This article describes in detail the index calculator in PIX4Dmapper.
- A DSM is used to generate the Reflectance Maps.
- One Reflectance Map is generated for each band of each group of images, but only one DSM is generated, regardless of the number of images' groups.
- The Reflectance Maps contain the reflectance values of each pixel and are used to generate the Index Maps.
- The Index Maps are calculated using some specific band(s) from one or more groups of images. Therefore, information from one or more Reflectance Maps may be used.
- If a Region is drawn, the Index Maps and Colored Index Maps will be generated only for this region.
- Colored Index Maps are generated by applying the defined coloring rules to the Index Maps. They are raster files with RGB values.
- If a Colored Index Map already exists, creating a new Colored Index Map will overwrite the existing one.
- For more information about the files that are generated, under which action and where they are stored: Menu Process > Processing Options... > 3. DSM, Orthomosaic and Index > Index Calculator.
- All the outputs will be stored in: ...\project_name\4_index
- For more information about the project folder structure: Project Folder Structure.
The existing results need to be backed up if they are to be kept.
The use of the Index Calculator is optional and allows to:
- Generate an Index Map / Index Grid where the "color" of each pixel is computed using a formula that combines different bands of the Reflectance Map(s).
- Visualize the Index Map as a Colored Index Map by applying a color mapping to it.
- Export a georeferenced Colored Index Map.
- Annotate the classes of the Index Map to generate an Application Map.
- Export an Application Map as a shape file to be imported in tractor consoles.
- Upload a Reflectance Map on MicaSense Atlas platform for processing, storage, management, presentation and analytics of multispectral data.
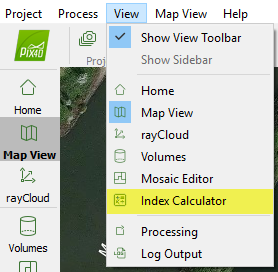
When selecting the Index Calculator view the following elements are displayed on the main window:
- Menu bar entry: Extra entry displayed on the Menu bar.
- Toolbar: The standard toolbar and some extra buttons related to the Index Calculator.
- Index View: Displayed in the main window. When opening the Index Calculator for a project for the first time, it is blank. Once at least one Reflectance Map has been generated, it displays by default the last index that was displayed before the project was closed.
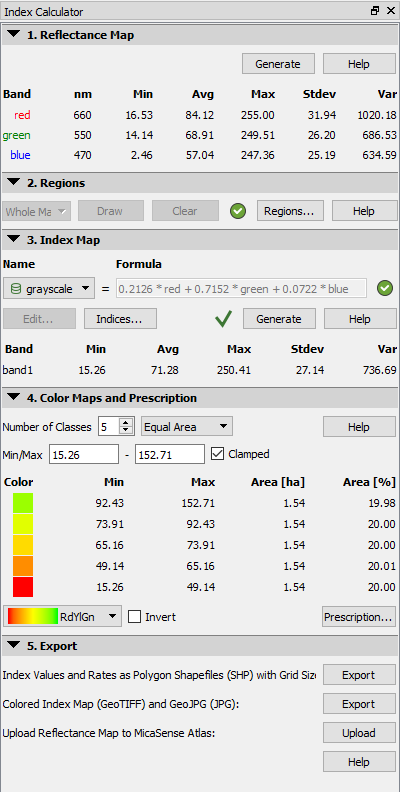
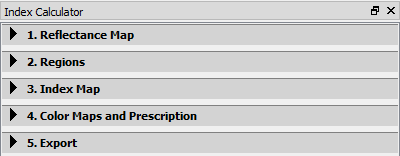
- Index Calculator sidebar: By default, it is displayed on the right of the Index View. Displays information about the Reflectance Map(s), the Index Map, and provides tools to generate and edit the Index Maps.
- Status bar: Displayed on the bottom right of the main window. Displays the Index Value, the coordinate system and the coordinates when passing the mouse over the Reflectance Map/ Index Map.
- For step by step instructions about how to use the Index Calculator: Using the Index Calculator.
On the Menu bar, by clicking on Index Calculator the following option is displayed:Menu bar entry
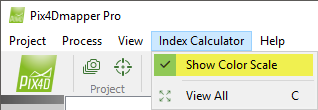
- Show Color Scale: By default it is selected. View/hide the color scale graphic of the Index Map that is displayed on the top right of the Index View.
- View All: Zoom in and out, so that the full Reflectance Map or Index Map is displayed in the Index View.

The following Toolbar buttons are displayed:
- Standard toolbar: For more information: Interface.
- Toolbar extra buttons:
- View:
 Zoom In: Zooms in the selected view.
 Zoom Out: Zooms out the selected view.
 View All: Zooms in and out, so that the full Reflectance Map or Index Map is displayed in the Index View.
- Reflectance map:
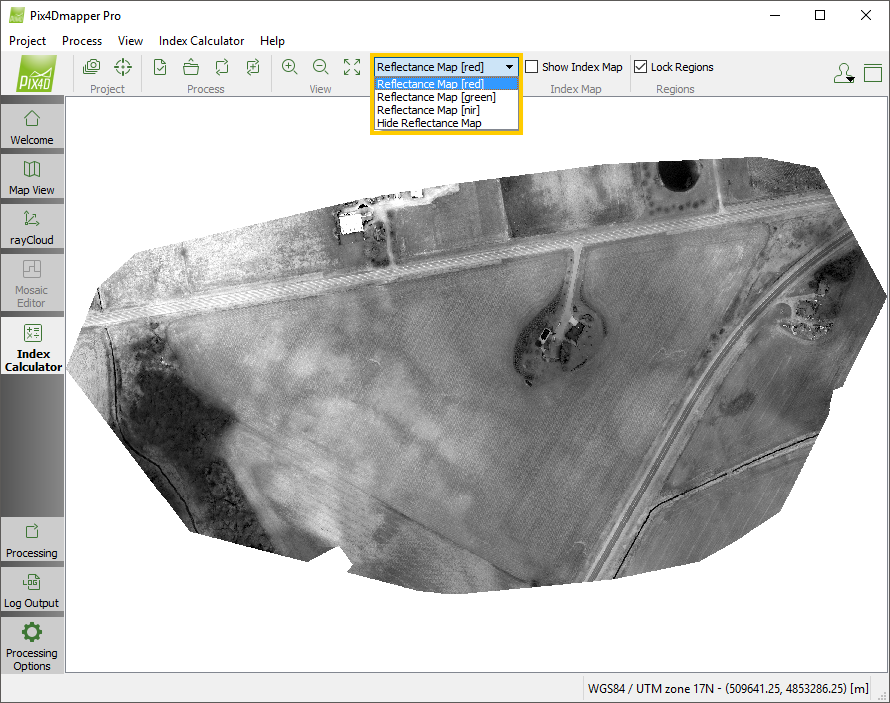
By default the Reflectance Map of the first band is displayed. The drop-down list gives the option to hide the Reflectance Map and select the Reflectance Map of a different band.
- Index Map:
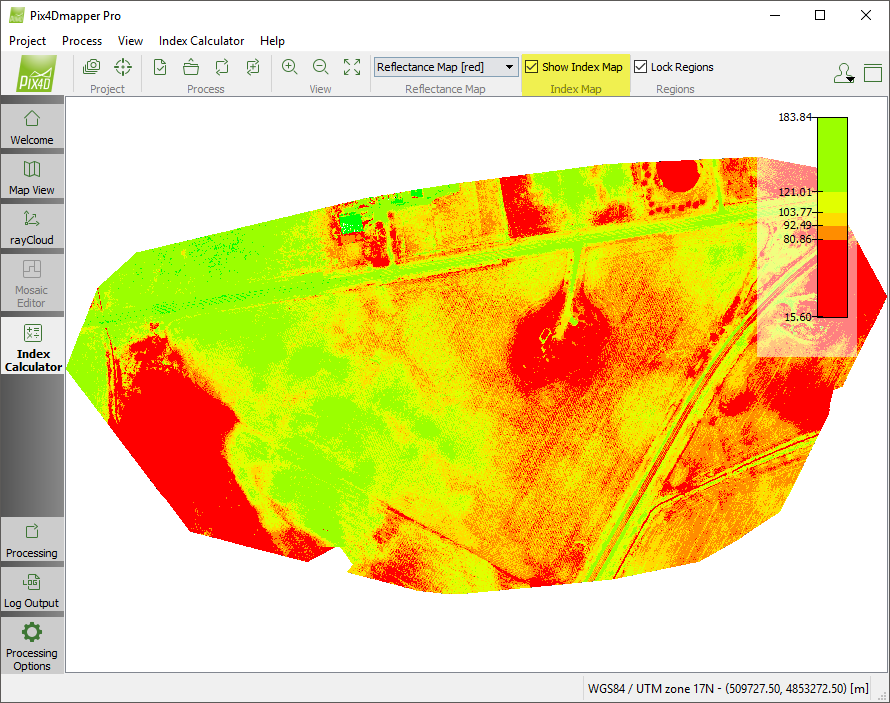
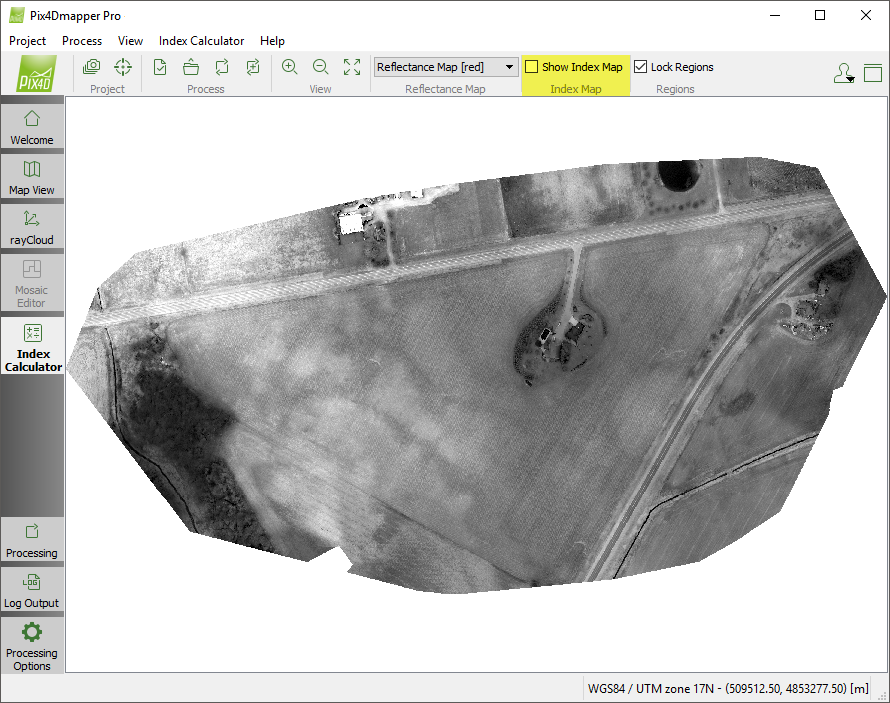
By default, the Show Index Map box is selected. This option controls whether the generated Index Map will be displayed and overlaid on top of the reflectance map.
- Regions:
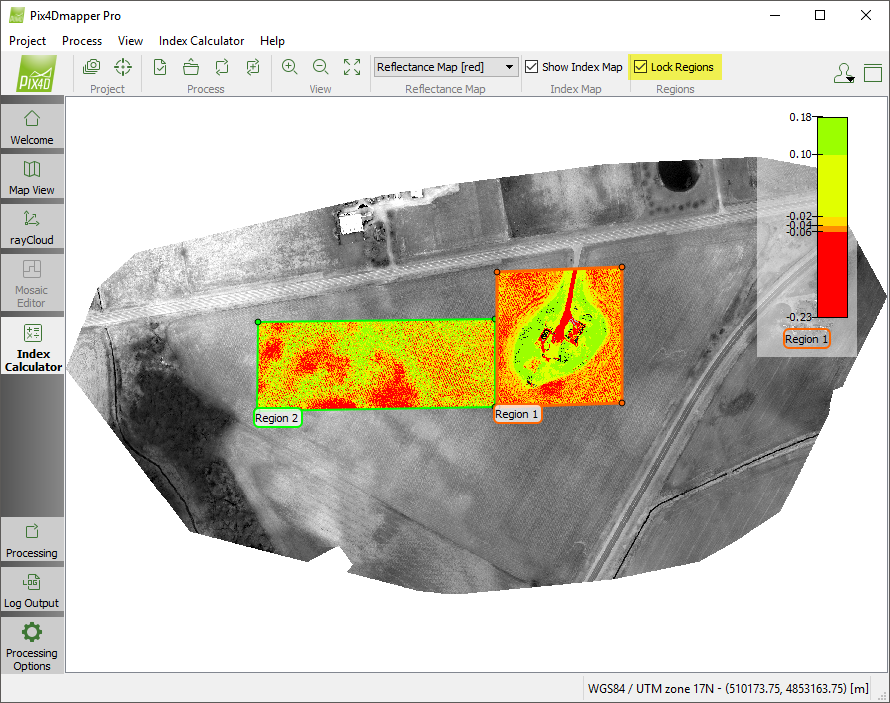
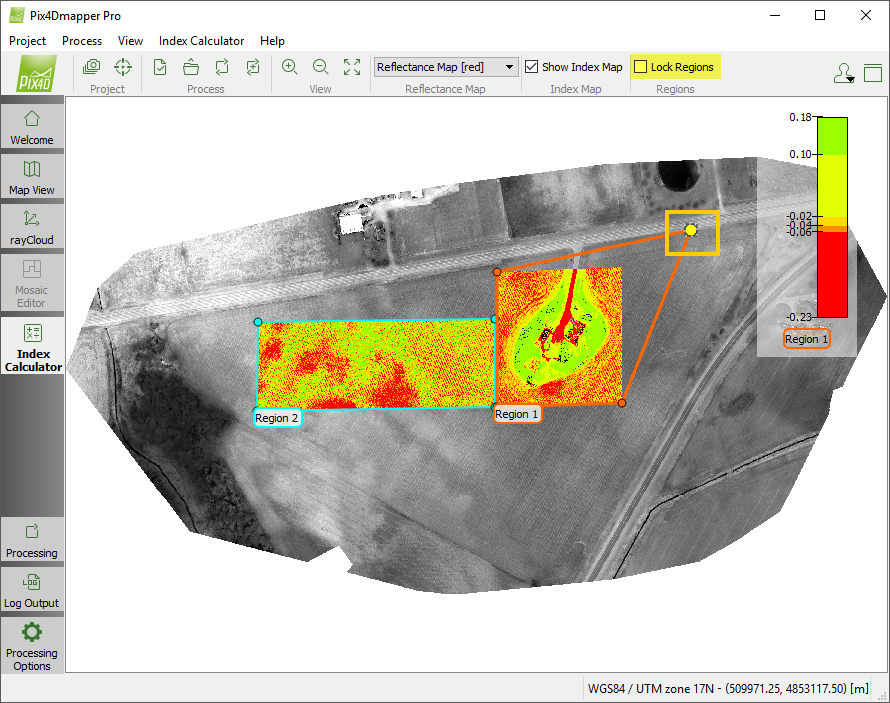
By default the Lock Regions box is selected. After the regions are drawn: Menu View > Index Calculator > Sidebar > 2. Regions, they will be displayed in the Index View. If the Lock Regions box is selected, the region frame will be locked in position. Unselect the Lock Regions box to enable the editing of previously drawn regions by dragging the whole region or a single vertex.
When opening the Index Calculator for a project for the first time, it is blank. Once at least one Reflectance Map has been generated, it displays by default the last Reflectance Map / Index Map that was displayed before the project was closed.
Navigating on the Index View using the mouse:
- Pan: Right/Left click and move the mouse (a hand icon appears representing the focus point for the movement).
- Zoom in: Move the scroll wheel forward while positioning the mouse over the Index View.
- Zoom out: Move the scroll wheel backwards while positioning the mouse over the Index View.
The sidebar displays information about the Reflectance Map(s) and the Index Map and provides tools to generate and edit the Index Maps.
For details about the Index Calculator Sidebar: Menu View > Index Calculator > Sidebar.
On the bottom right part of the main window, if a Reflectance Map / Index Map is loaded in the Index View, the following information is displayed:

- Index Value: Displays the pixel value of the Index under the current mouse location. When passing the mouse over the Index View, the value changes.
- Output Coordinate System: Displays the selected output coordinate system.
- Coordinates: Displays the (X,Y) coordinates in meters / feet of each point of the Reflectance Map / Index Map. When passing the mouse over the Reflectance Map / Index Map the coordinates change.