IN THIS ARTICLE
2D/3D tools
Annotations
How to attach an image to an annotation
Licenses: This article is valid for all PIX4Dcloud licenses.
- Owners, Managers, Editors and Reader can view datasets in PIX4Dcloud.
- Only Owners, Managers, and Editors can make permanent changes (save annotations, import files, etc) in a datasets in PIX4Dcloud.
2D/3D tools
The 2D/3D tools allow the user to select, modify and create annotations in the 2D and 3D views. The available tools are:
 Select and Modify: It allows users to pan the map/model, select and modify an element in the views, visualize its details in the Details panel.
 Measure a distance or elevation: It allows users to draw a (poly)line annotation and extract measurements. An elevation profile can be generated from a distance measurement. More information in: How to generate an elevation profile.
 Measure an area: It allows users to draw a polygon annotation and extract measurements from it.
 Measure a radius: It allows users to draw a circle and extract measurements from it.
 Measure a volume: It allows users to draw a base surface upon which a volume annotation is created and volume measurements can be extracted.
 Add a marker: It allows users to add a point-like marker annotation and extract measurements from it.
 Inspect: It allows users to add an inspection to the project. More information in: What is the Virtual Inspector?

The measurement unit displayed in the 2D/3D view is the one selected in the account settings or the one chosen in the unit selector, on the bottom bar. More information at PIX4Dcloud - FAQ. For more information on annotations coordinate system: Georeferencing of datasets, outputs and annotations.
Annotations
Video: The following video tutorial explains step-by-step how to add and edit the annotations created in a project in PIX4Dcloud.
Information: Note that the presence of the DSM in the dataset is required before creating annotations.
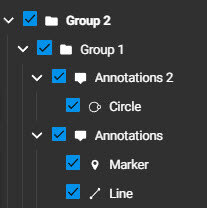
Annotations layers can include:
Multiple Annotations layers can be created to organize the annotations into Groups better.
To create an additional Annotations layer or a Group, click  next to Layers.
When clicking the Annotations layer, the details panel opens on the right.
- Name
- (optional) Description
- (optional) Tags
- Settings
- Visible: set the layer as visible or not visible.
- Opacity: adjust the opacity level from 0 to 100.
- Number of annotations: it shows the number of annotations belonging to the layer.
Annotations can be exported and imported. More information in: How to export/import annotations.
Line
To measure a distance:
- Click
 .
. - In the 2D/3D view, left-click on the map/model to draw points of the polyline. Right-click or left-click twice to draw the last node.
When clicking on a Line item in the Annotations layer or after drawing it, the details panel opens on the right.
- Name
- (optional) Description
- (optional) Tags
- Color: displayed color of the line.
- Measurements
- 2D length: length of the line projected on the 2D DSM.
- 3D length: length of the 3D line.
- Min. elevation: lowest elevation of the points forming the (poly)line.
- Max. elevation: highest elevation of the points forming the (poly)line.
- Elevation difference: difference between the highest and the lowest elevations.
- Min. slope: minimum gradient value of the polyline.
- Max. slope: maximum gradient value of the polyline.
- Slope as percentage: display the above slope as percentage or in degrees.
- Generate elevation profile: produce an elevation profile from the line. More information in: How to generate an elevation profile.
Polygon
To measure an area:
- Click
 .
. - In the 2D/3D view, left-click on the map/model to draw points of the polygon. Right-click or left-click twice to draw the last vertex of the polygon.
When clicking on a Polygon item in the Annotations layer, the details panel opens on the right.
- Name
- (optional) Description
- (optional) Tags
- Color: displayed color of the polygon.
- Measurements
- 2D area: area of the polygon projected on the 2D DSM.
- 3D area: area of the 3D polygon.
- 2D perimeter: perimeter of the polygon projected on the 2D DSM.
- 3D perimeter: perimeter of the 3D polygon.
- Min. elevation: lowest elevation of the vertices forming the polygon.
- Max. elevation: highest elevation of the vertices forming the polygon.
- Elevation difference: difference between the highest and the lowest elevations.
Circle
To measure a radius:
- Click .
- In the 2D/3D view, right-click on a point that will define the center of the circle. Then move the mouse and right-click on a second point to define the radius of the circular area that needs to be covered.
When clicking on a Circle item in the Annotations layer or after drawing it, the details panel opens on the right.
- Name
- (optional) Description
- (optional) Tags
- Color: displayed color of the circle.
- Measurements
- Radius: length of the radius projected on the 2D DSM.
- 2D area: area of the circle in 2D.
- Center X: X coordinate of the center point of the circle in the output coordinate system.
- Center Y: Y coordinate of the center point of the circle in the output coordinate system.
- Center Z: Z coordinate of the center point of the circle in the output coordinate system.
- Center Coordinates (WGS84): coordinates of the center point of the circle in the WGS84 coordinate system.
Volume
To measure a volume:
- Click
 .
. - In the 2D/3D view, left-click on the map/model to draw the points of the base surface of the volume. Right-click or left-click twice to draw the last vertex of the surface. More information in How to calculate volumes on the Cloud.
When clicking on a Volume item in the Annotations layer, the details panel opens on the right.
- Name
- (optional) Description
- (optional) Tags
- Color: displayed color of the volume base surface.
- Measurements
- 2D area: area of the polygon projected on the 2D DSM.
- 3D area: area of the 3D polygon.
- 2D perimeter: perimeter of the polygon projected on the 2D DSM.
- 3D perimeter: perimeter of the 3D polygon.
- Min. elevation: lowest elevation of the vertices forming the polygon.
- Max. elevation: highest elevation of the vertices forming the polygon.
- Elevation difference: difference between the highest and the lowest elevations.
- Volume
- Base surface: select the type of base surface from the drop-down menu. More information in: Which Base Surface is recommended for the Volume Calculation.
Marker
To add a marker:
- Click
 .
. - In the 2D/3D view, left-click on the map/model to add the markers.
When clicking on a Marker item in the Annotations layer, the details panel opens on the right.
- Name
- (optional) Description
- (optional) Tags
- Color: displayed color of the marker.
- Measurements
- Coordinates (WGS84): latitude and longitude values in WGS84.
- X: X coordinate in the projected coordinate system of the project.
- Y: Y coordinate in the projected coordinate system of the project.
- Z: Z coordinate in the projected coordinate system of the project.
- Elevation: altitude of the point in the coordinate system of the project and in the measurement unit specified in the user's Account settings.
Inspection
Read the documentation about the Virtual inspector at How to access and use the Virtual Inspector.
How to attach an image to an annotation
PIX4Dcloud allows adding an image to any of the annotation types described in this article.
In order to see how to do that: How to attach an image to an annotation.
Information: This feature is only available if the annotation and the image is uploaded from PIX4Dcatch.