This article explains how to use the advanced layer visualization in PIX4Dfields.
IN THIS ARTICLE
General information of a layer
Color mode
Histogram for Indices
The dynamic range
Display modes
Histogram equalization
Dimensions
GSD
File Size
Data Type
Coordinate System
Bands
Acquisition
Radiometric Correction Type
Try PIX4Dfields now
General information of a layer
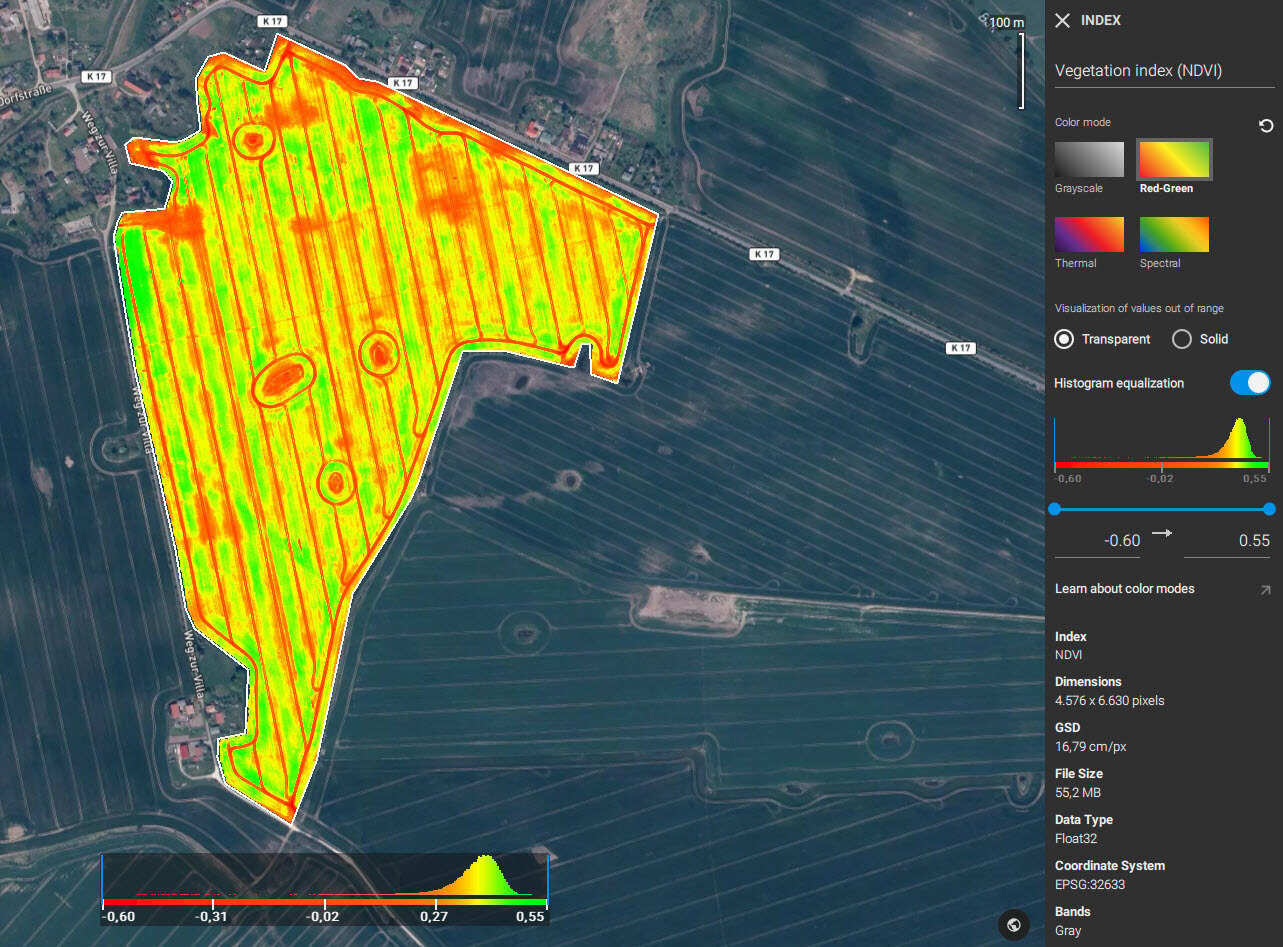
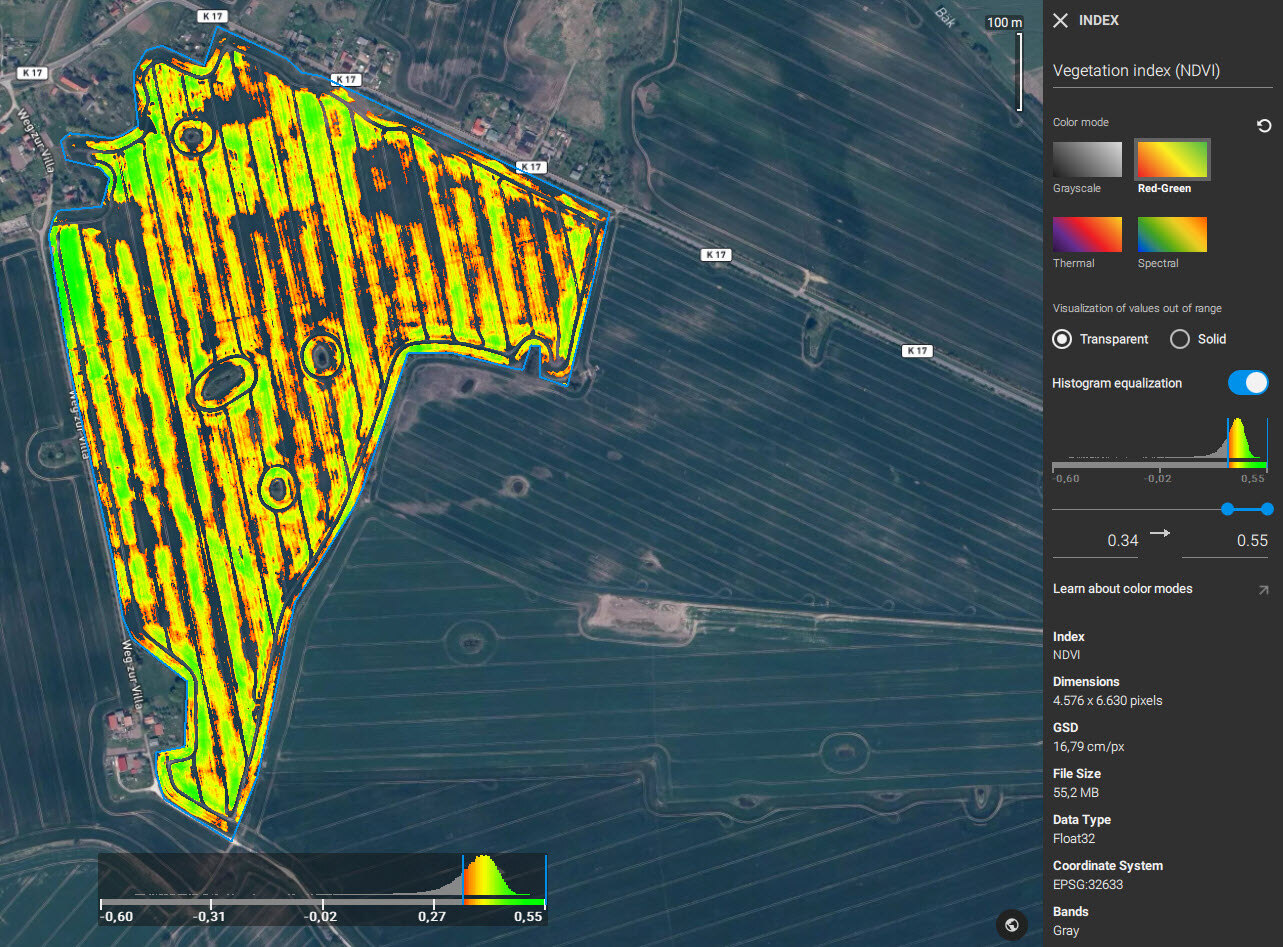
Click on the layer to display the general information, and to change the color mode, range, and contrast of a histogram.
Color mode
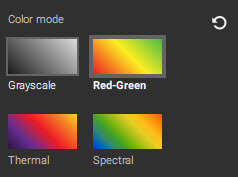
- Grayscale: A monochromatic display ranging from black (low pixel values) to white (high pixel values).
- Red-Green: A common color mode for vegetation indices. The color display ranges from red (low pixel values) to green (high pixel values).
- Thermal: This color mode is visualized on the scale of black/purple to yellow/white. This is not a thermal map and does not represent temperature values.
- Spectral: The color display ranges from blue (low pixel values) to red (high pixel values).
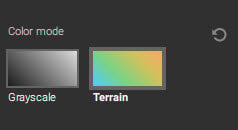
- Terrain: Designed for Digital Surface Models (DSM), the blue to orange color mode is a relative representation of terrain elevations from low to high.
Histogram for Indices
The histogram is a visual representation of the distribution of pixel values within the selected layer, or more specifically, the raster dataset. The horizontal axis (x) displays the range of pixel values and the vertical axis (y) displays the frequency of occurrence of the pixel. Histograms can provide useful insights into your data.
For more information about vegetation indices: Generate a vegetation index.
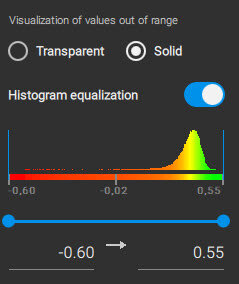
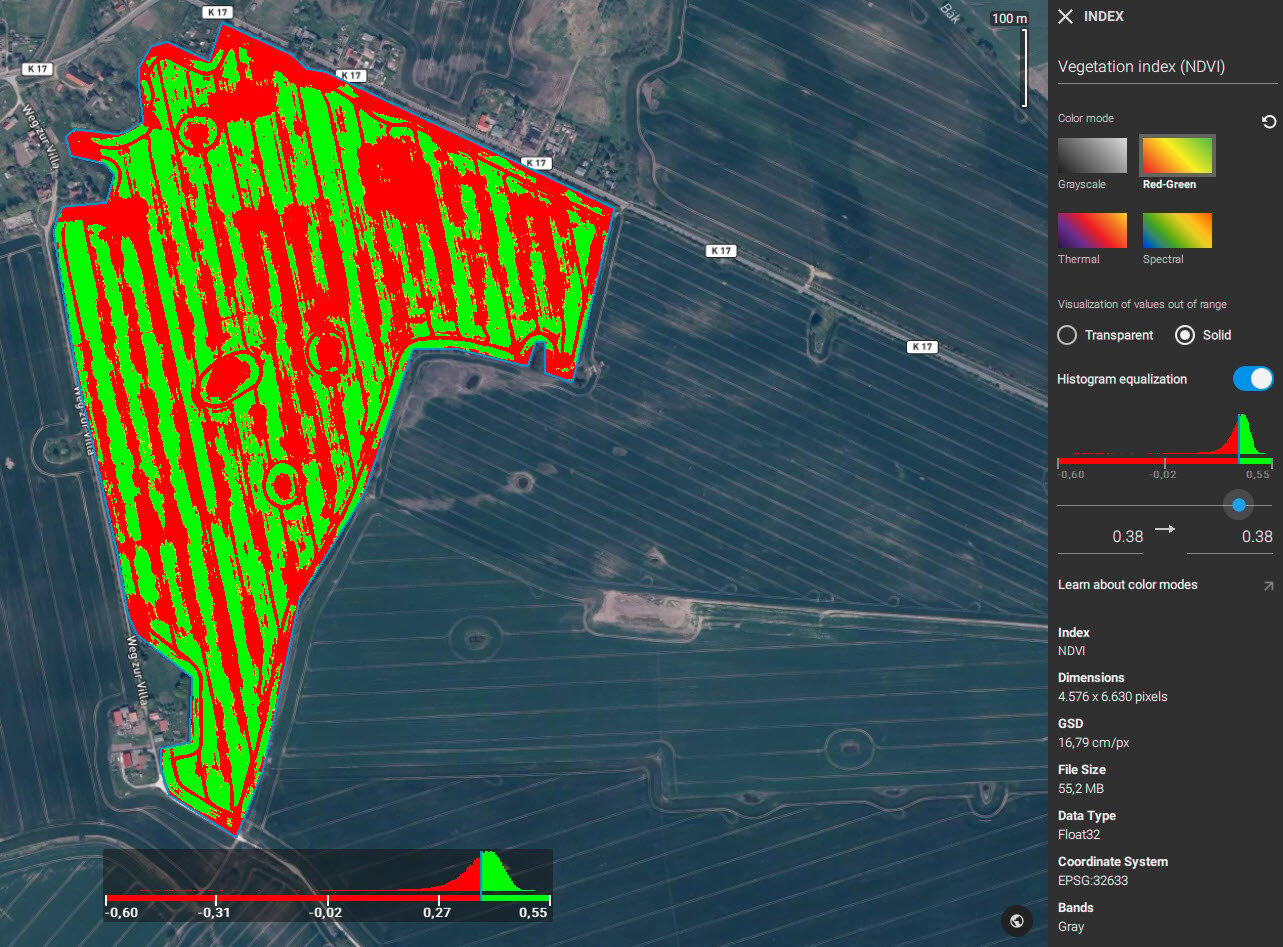
The dynamic range
The dynamic range is the difference between the darkest and brightest parts of your layer. PIX4Dfields allows the minimum and maximum pixel values to be adjusted in order to set the dynamic range.
Changing the range on the horizontal axis (x) changes the symbology, or coloring, of the layer. The example below illustrates different settings of the dynamic range, which can better distinguish stressed and health areas.
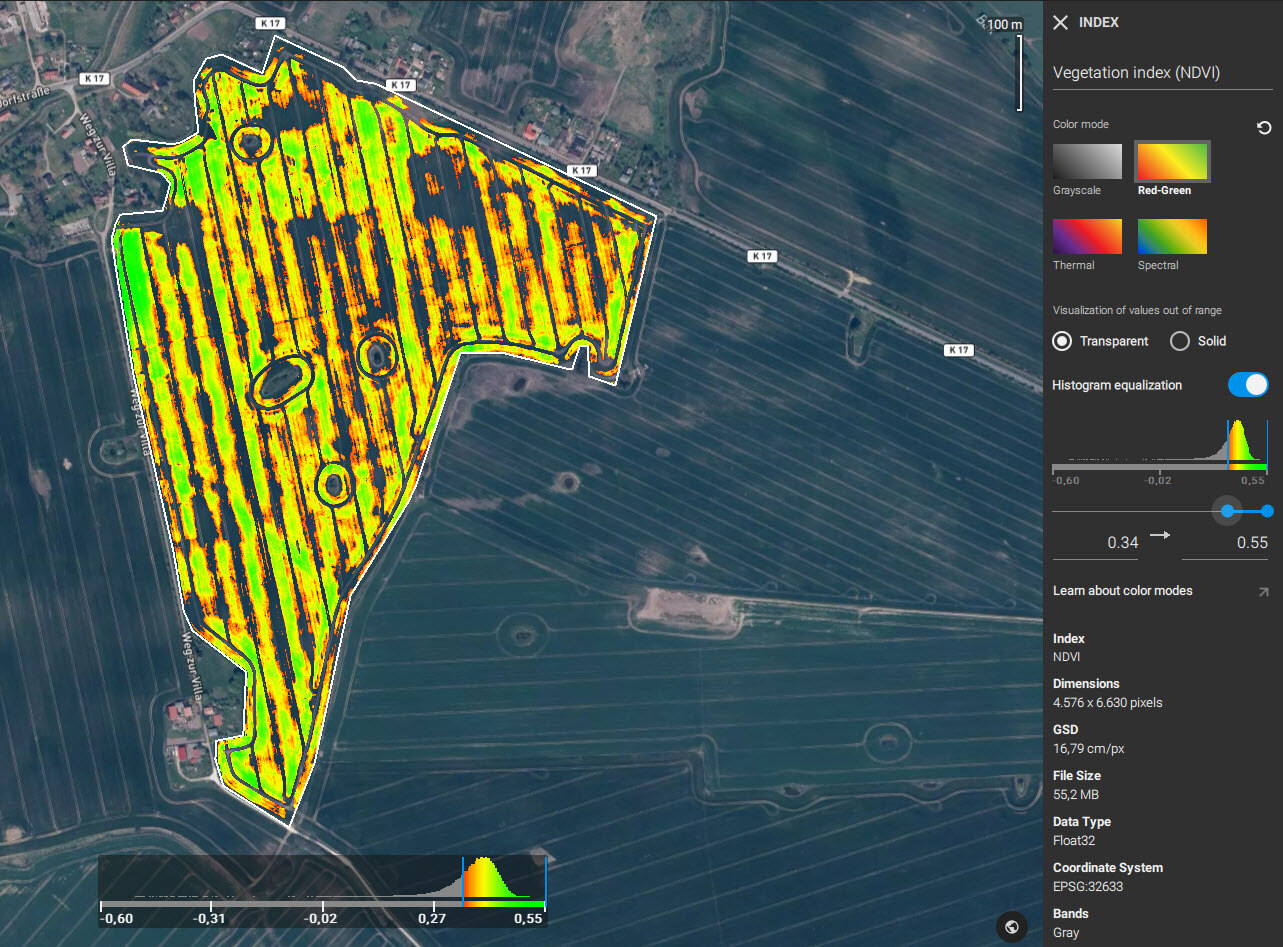
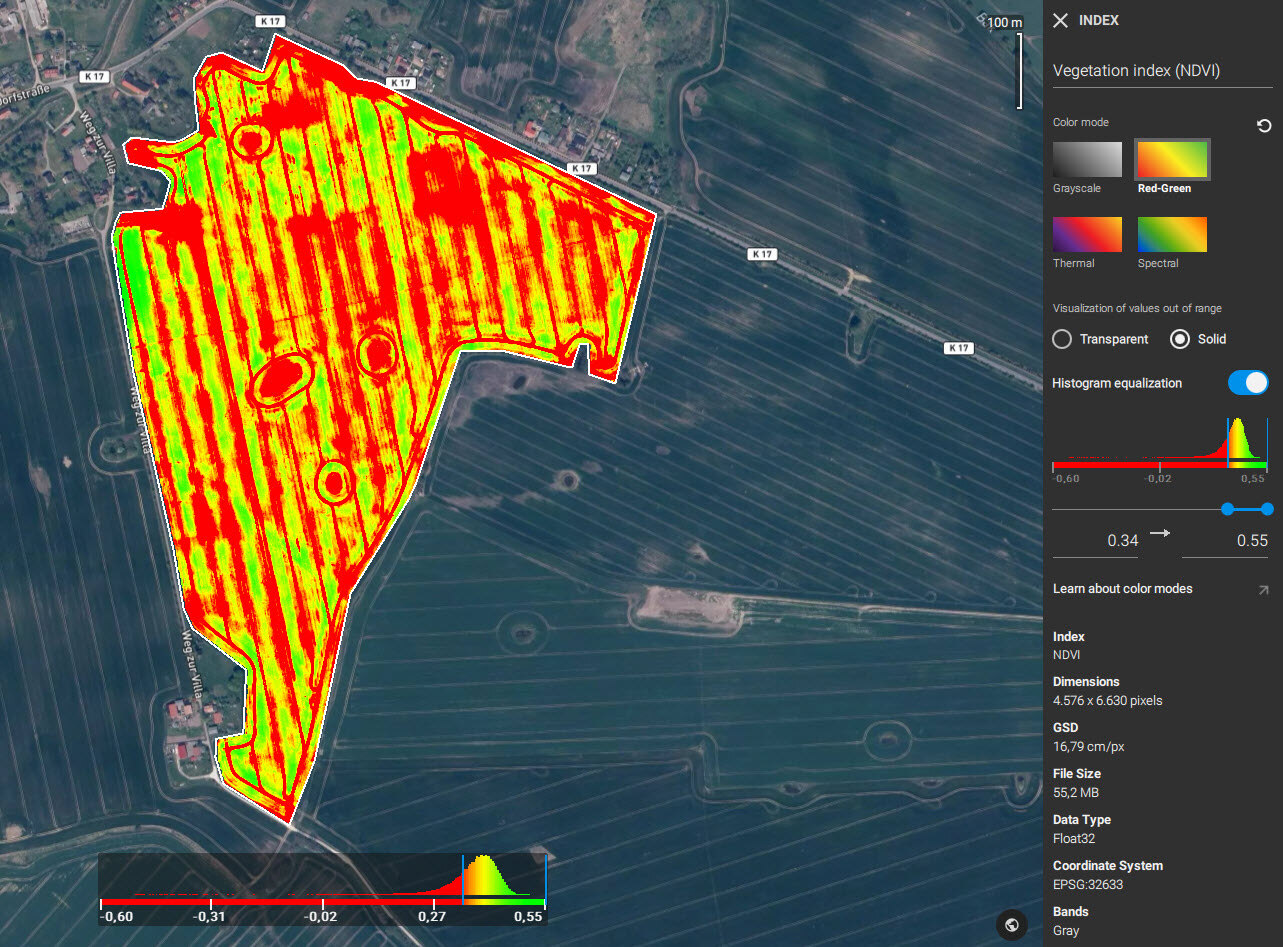
Display modes
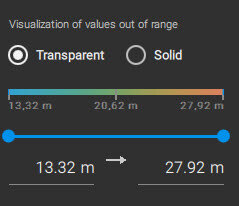
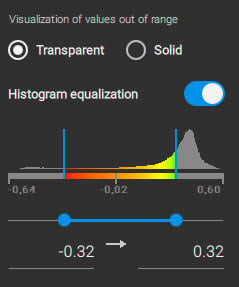
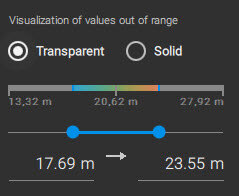
PIX4Dfields offers two display modes of the pixels with data values below and above the specified color range: transparent and solid.
- Transparent mode displays all areas with pixel values outside the given range as transparent.
- Solid mode displays areas below of the given range with one opaque color and the values above the selected range with another opaque color. The colors which the solid mode displays depend on the selected color mode (Red-Green, Spectral, Thermal and Grayscale). For example, if the color mode is Red-Green then the values above the selected range will be displayed as green, and the values below the range will be displayed as red.

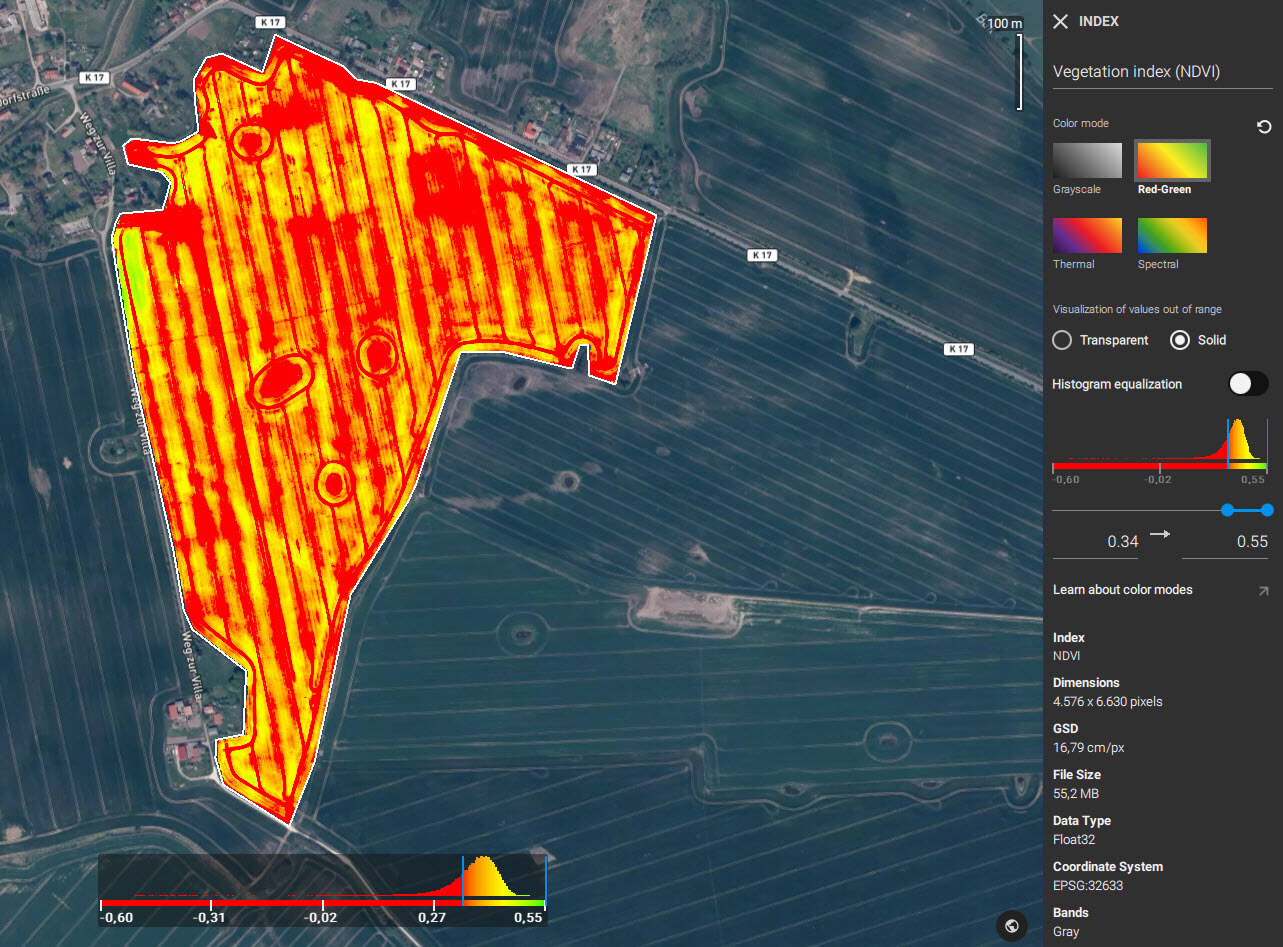
Histogram equalization
Histogram equalization enhances contrast by stretching out the most frequent intensity values in the histogram. PIX4Dfields can enhance an image by using a histogram equalization process.
Dimensions
The dimensions (in pixels) of a layer depends on the area covered by the input images and the GSD.
GSD
The Ground Sampling Distance (GSD) is the distance between two consecutive pixel centers measured on the ground typically measured in cm or in. The higher the GSD value, the fewer details that are visible on the ground (less spatial resolution). The GSD value and spatial resolution are a function of the altitude of the drone flight and the camera parameters. However, the GSD can be determined by the settings in the advanced processing options. For more information about GSD: Orthomosaic GSD in PIX4Dfields
File Size
The file size depends on the number of pixels and the number of bits of your images.
Data Type
PIX4Dfields supports TIFF images with 8, 10, 12, 14, and 16 bit integers, and floating-point as inputs. For more information: Inputs and Outputs
Coordinate System
PIX4dfields uses the Universal Transverse Mercator (UTM) coordinate system based on the WGS84 ellipsoid. The EPSG code for the corresponding UTM zone is displayed.
Bands
This section describes the type and composition of the image layer. For an orthomosaic, the type of spectral bands that comprise the image are listed. A vegetation index will be listed as Gray denoting a single band, and a DSM will simply state DSM.
Acquisition
Displays the time of acquisition and the duration of your flight. This information is extracted from the EXIF tags on your input images.
Radiometric Correction Type
The radiometric correction type that PIX4Dfields used on your project can be seen when clicking the corresponding orthomosaic.
PIX4Dfields performs different types of radiometric correction, depending on the availability of the following sources: Image EXIF tags, sunshine sensor, reflectance targets, thermal profile, and weather conditions during the capture. For more information: Radiometric correction in PIX4Dfields
Try PIX4Dfields now
Try PIX4Dfields now! Register for a free 15 days trial, and download our Example datasets to test the advanced layer visualization.