Zonation creation
Since PIX4Dfields 2.5 we introduced an entirely new zonation feature located within Targeted Operations, to access it:
- Click
 Operations icon located next to the
  Magic icon.
 - [1] Select Zonation (pre-fill grid with an index layer).
- [2] Select the Base layer on which the zonation will be created. The layer can be either an index or a Digital Surface Model (DSM) layer.
- Select the Boundaries for the zonation, at least one boundary has to be selected.
- Select the Obstacles (Trees, poles, etc.) that will be present in the mission, if any.
- [3] The unit can be determined in this step and changed later on the Operation menu. Re-name the Operation layer if needed.
- [4] The Zonation is based on a grid. Select a cell size roughly representing the structures that must be differentiated on the map. The cell size could match the implements section or working width. Using the same orientation as the crop row or the main driving direction (A-B line) is recommended.
- [5] Adjust the histogram again if needed. Only visible pixels visible on the screen will be used for the zonation.
- [6] Exclude cells with less than: This setting refers to the behavior of the new grid cells with non-visible pixels, hence values outside the histogram range. This is very useful for Green-on-Brown spraying, as you can select only cells with a certain threshold of weed pixels.
[7] Zonation settings
The seventh step, Zonation settings, enables configuration to accommodate various aspects, enhancing adaptability across diverse applications.

Number of zones
Set the number of desired zones. The goal is to make differences in the source data more accessible to read without sacrificing too much complexity of the source data. It is ideal for each unique zone to be homogeneous in its properties and compact in its location. Setting an uneven number of zones like 3, 5, and 7 is recommended to redistribute inputs from a fixed rate field application to a variable rate.
In this case, the medium zone will represent the fixed rate that would have been used.
Index value of cell
It refers to how the index value of the cell is calculated, it can be the Mean of the pixels that fall into that cell, or it can take the Minimum or Maximum value that is present.
Zone detail
Simplify the zonation by moving the slider to the right.


Histogram
The default settings will take out extreme values (outliers) of the histogram.
It is essential to understand that the zonation will be based on the values inside
the histogram, so-called “visible” pixels.
This allows the creation of zones within ranges of interest. You can set a custom
range with the slider below the histogram.
Zone distribution
Equal intervals
It will split the values inside the visible pixels of the histogram into equal intervals/ranges. The number of intervals refers to the Number of zones set in the left-hand-side menu.
In the example below, the data distribution goes from 0.2 to 0.340 (visible pixels). When setting 3 zones and Equal intervals, it will split the data into 3 ranges, each one covering 0.03. Zones are as follows:
Zone 1: From 0.2 to 0.247, Mean index 0.24.
Zone 2: From 0.247to 0.293, Mean index 0.27.
Zone 3: Form 0.293 to 0.340, Mean index 0.30.

Quantile
This zone distribution will split into regular intervals considering the data distribution. This setting is helpful to highlight and boost even slight heterogeneity in your crop development, allowing you to exploit those for application. Keep in mind that the quantile zones will represent the same area in the field, if setting the Zone detail to Fine.
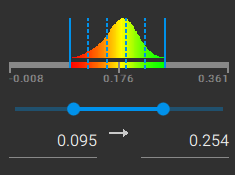
Using the same example as before, when setting three zones and Quantiles, zones are as follows:
Zone 1: From 0.2 to 0.269, Mean index 0.25.
Zone 2: From 0.269 to 0.289, Mean index 0.28.
Zone 3: Form 0.289 to 0.340, Mean index 0.30.
Note that Zone detail is set to Fine, and each zone covers 33.31% of the field.

Manual intervals
It helps if the user has a model using a certain vegetation index and they know it relates to a status on the field, and they need to manually set the brackets, i.e., 0.2 to 0.3, low presence of fungus, 0.3 to 0.6 medium pressure, above 0.6 high pressure.

To go back to the default settings, click Reset all.
Click Preview to see what the zonation looks like. Adjust zonation if needed.
After clicking Preview, the zonation statistics are estimated, helping to understand each zone's characteristics:
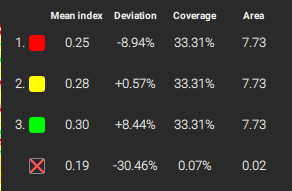
- The Mean index refers to the average index value of each zone.
- Deviation refers to the difference between the zone mean index and the whole field mean index. It provides a quick idea of how the zone compares to the rest of the field. In this case, Zone 3 is 8.44% better than the field mean, which is close to 0.28.
- Coverage refers to the area expressed in percentage.
Click Create operation layer to finish creating the Targeted Operation zonation.
Operation menu
After creating the Targeted Operation zonation, the Operations menu appears. It will help adjust zonations manually, set rates and more. For more information: Operations menu - PIX4Dfields.
Export Zonation
In order to export the Zonation map, go to Export, Operations. Follow the step-by-step in this article: How to export a targeted spraying prescription map.
In order to export to a DJI Agras T-series, please visit: Spot spraying and variable rate prescriptions for DJI Agras T-series with PIX4Dfields.
Try PIX4Dfields now
Both new and existing Pix4D accounts are eligible for a 15-day free license to PIX4Dfields. The trial is activated when logging in to PIX4Dfields for the first time.
For more information: Trial, sign-up and login - PIX4Dfields.