

点のグリッドツールは、スポット標高の作成を自動化し、点群の点の数を大幅に簡素化するのに役立ちます。 新しい点は作成されず、入力データから既存の点のみが使用されます。
3つのタイプがあります。
- レギュラーグリッドは、選択した点の間のサンプリング距離に基づいて生成されます。
- ローパスグリッドは、Z 範囲で機能するフィルタに基づいて生成されます。
- スマートグリッドは、地形の標高が変化した場所にのみポイントを作成します。
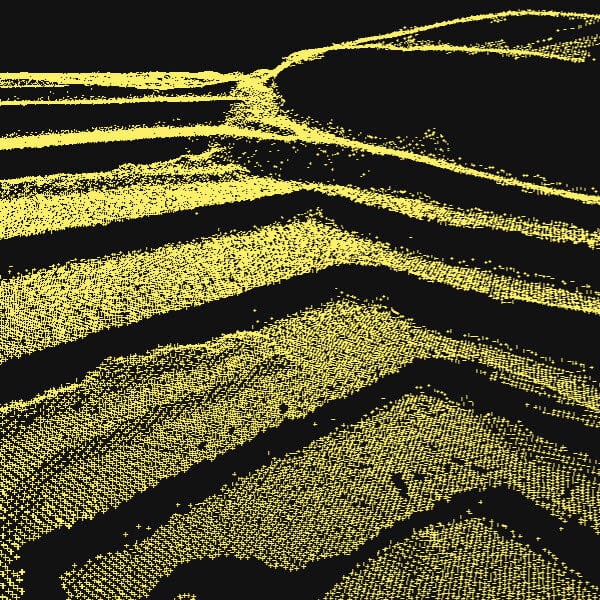
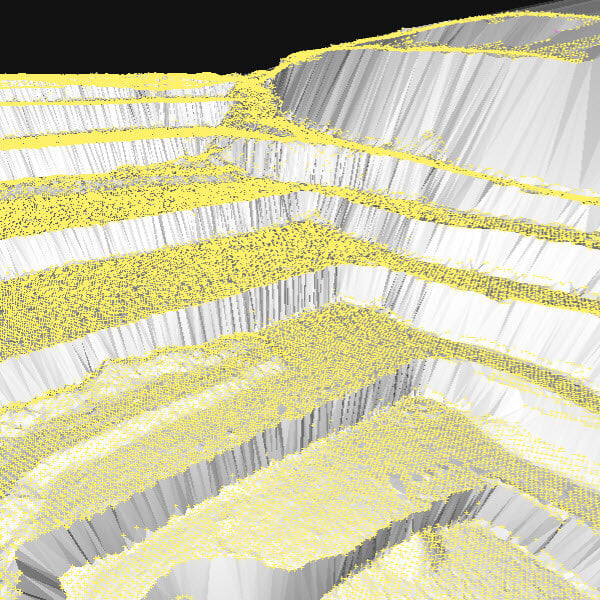
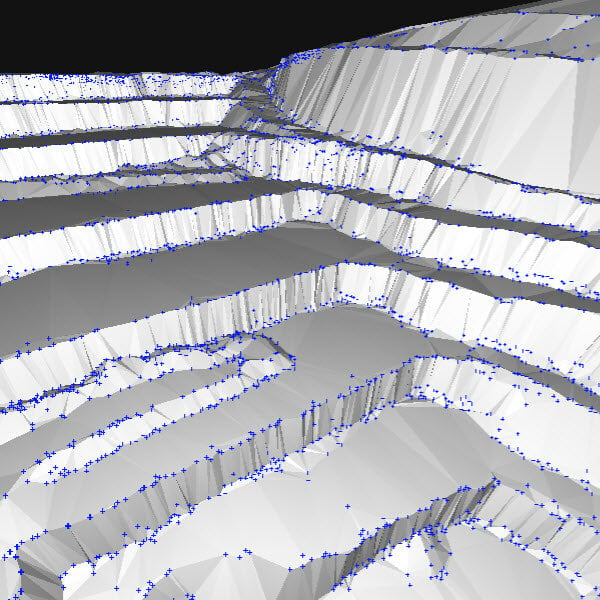
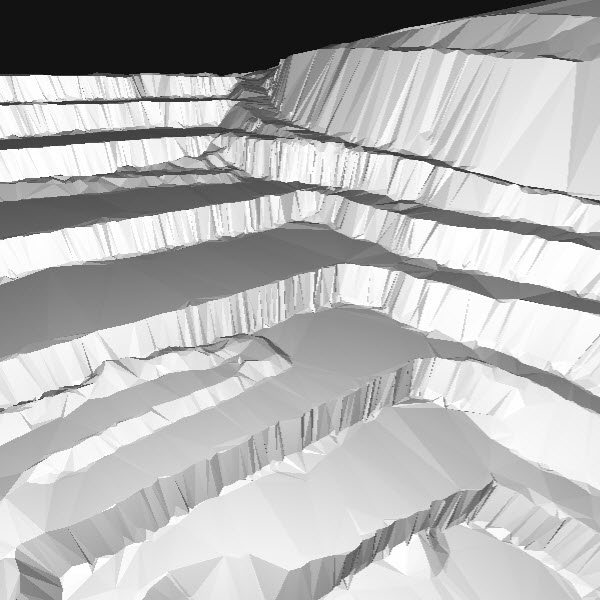
例: レギュラーと スマート の 点のグリッド処理の結果の比較。 スマートオプションは、地形の変化があるところだけに点を生成していることに注目してください。 同じ サンプル距離を使用しても、地形を正確に記述しながら生成される点が大幅に少ないため、出力ファイルが小さくなり、CAD または GIS ソフトウェアにインポートしやすくなります。
アクセス
- 処理
 をクリック、
 - メニューバーで、処理> 点のグリッド をクリックします。または、
- コンテンツパネルで、 TIN >点のグリッド >

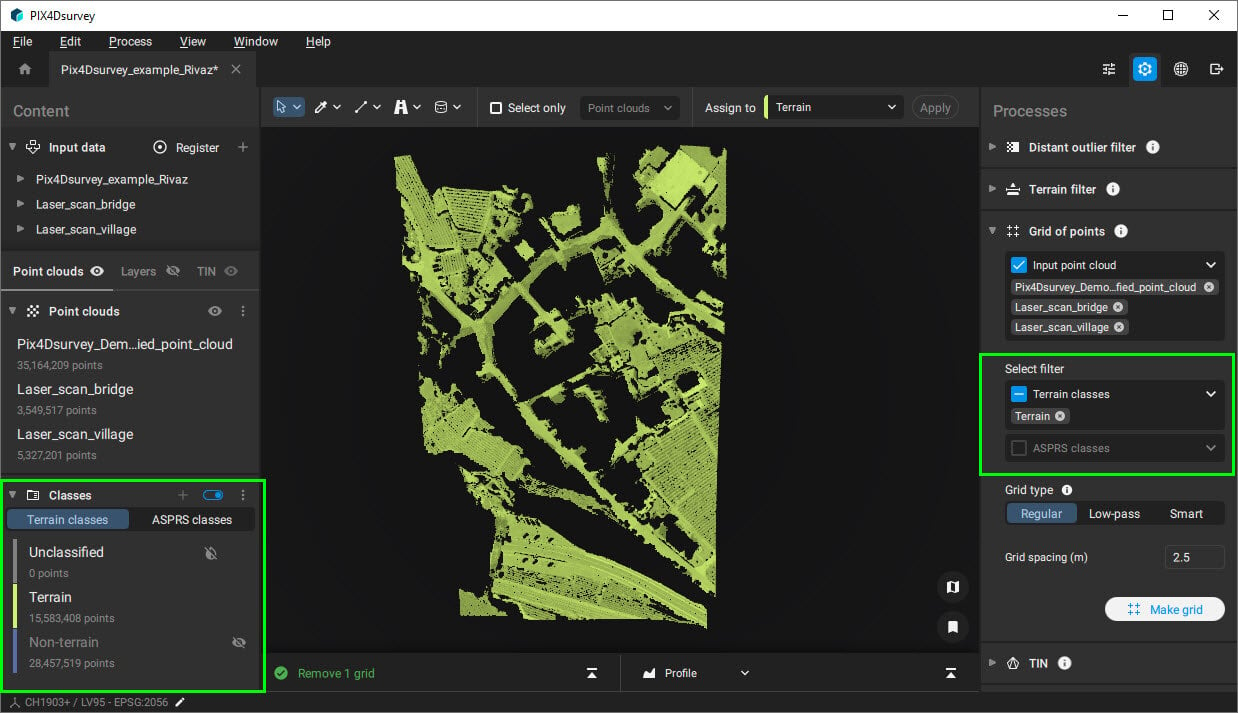
入力点群
点のグリッドの処理に使用される点群を定義します。
- すべて : コンテンツ内のすべての点群。処理にはが使用されます。
- 表示のみ - デフォルト コンテンツ>点群と 地形クラスに表示される点群のみが処理に使用されます。
- 地形 - 地形ポイントが利用可能な場合のデフォルト : 地形クラスのすべての点が処理に使用されます。 地形フィルタが処理された後にのみ使用できます。
- 非地形 : 非地形クラスのすべての点が処理に使用されます。 地形フィルタが処理された後にのみ使用できます。
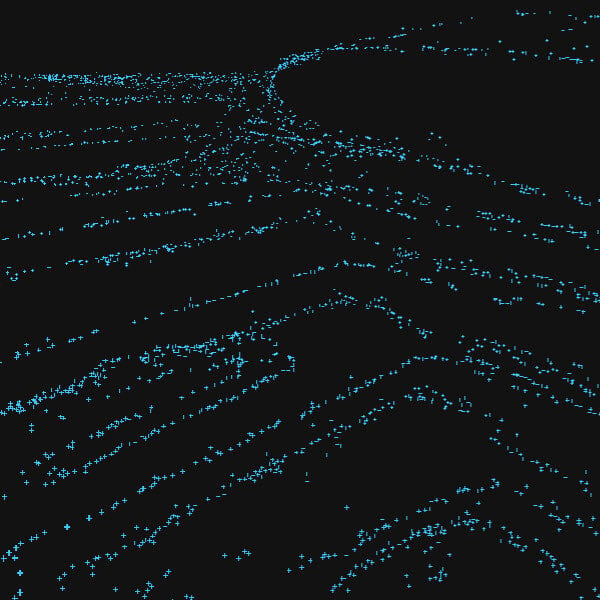
例: 地形オプションを選択すると、地形クラスとして分類されたポイントのみが処理に使用されます。
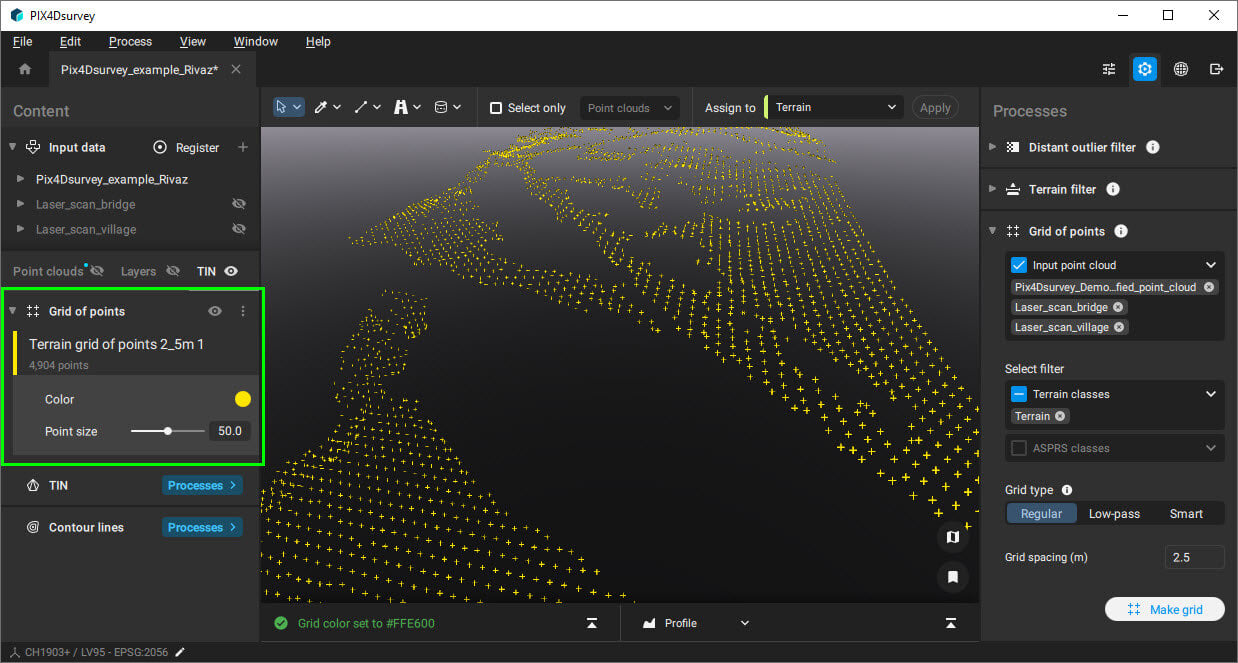
レギュラーの点のグリッド
レギュラーグリッドは、選択された点の間のサンプル距離に基づいて間引かれた単純な長方形のグリッドです。
- グリッド間隔 [単位] : グリッド サイズを決定します。
- 0.1 m - 30 m、2.5 m - デフォルト。
- 0.3 フィート - 100 フィート、8 フィート - デフォルト。
ローパスの点のグリッド
ローパス グリッドは、 グリッド間隔 (サンプリング距離) に基づく各セル内の点群ポイントに基づいて生成されます。 セル内で、ローパスは垂直分布を見て、正しい垂直スライス内の点を選択します。
- グリッド間隔 [単位] : グリッド サイズを決定します。
- 0.1 m - 30 m、2.5 m - デフォルト。
- 0.3 フィート - 100 フィート、8 フィート - デフォルト。
- Z-範囲 [任意の単位]: Z軸に沿ったフィルターの高度を決定します。
- 0 - 10、1 - デフォルト。
例: ローパス グリッドは、植生の多い地域の場合に役立ちます。 このような状況では、Z 範囲の値が下端にある場合、グリッドの点は地面になります。 一方、Zレンジの値を高い方に設定すると、グリッドの点がキャノピー上になります。
次の例では、0 の Z 範囲が使用されました。
ビデオ: 次のビデオは、LiDAR データセットに対するローパス グリッドの効果を示しています。 森林や下草の中でも、地面の点を含めることができます。
スマートの点のグリッド
スマート グリッドは、地形を定義する最も重要な点のみを生成しようとします。
グリッド間隔 、 点のグリッドの数 、および標高差に基づいて、アルゴリズムは平面領域に冗長なポイントを作成することを回避し、 地形が変化した場所にのみ 点を生成することに重点を置きます。
次のパラメータを調整できます。
- 最小グリッド間隔 [単位]: 最も重要な点を見つけるための開始点として使用される初期グリッド間隔。
- 0.1 m - 30 m、2.5 m - デフォルト。
- 0.3 フィート - 100 フィート、8 フィート - デフォルト。
- Z-範囲 [任意の単位]:Zに沿ったフィルターの高度を決定します。
- 0 - 10、1 - デフォルト。
- グリッドの点の最大数:最終結果におけるグリッドポイントの最大可能数です。
- 3 - 1000000、1000 - デフォルト
- 最大標高変化 [単位]: 近隣の点からの最大標高変動。
- 0.01m - 5m、0.05m - デフォルト
- 0.03 フィート - 16 フィート、0.15 フィート - デフォルト
アクセス: 点のグリッド処理の結果は、 コンテンツ> TIN >  点のグリッドパネルで確認できます。
ヒント: ポイント グリッド処理の結果に含まれるポイントは、入力点群よりも大幅に少なくなります。 コンテンツパネル内の 点のグリッドを右クリックし、ポイントのサイズを大きくすると見やすくなるのでおすすめです。
エクスポート
点のグリッド処理の結果は、.dxf、.shp、.zip (.shp)、.csv, .las、.lazおよび geojson 形式でエクスポートできます。 詳しくはエクスポート記事をご覧ください。