IN THIS ARTICLE
- This feature is available to all PIX4Dcloud licenses.
- Only Owners, Managers, and Editors can add Field and Fields boundary in a dataset.
- The Field and Field boundary features are only available when the dataset is uploaded from PIX4Dfields to PIX4Dcloud using the Share to Cloud functionality.
How to add a Field
A Field is a polygon that masks the Index map and displays a histogram of index values for the selected area.
To add a Field:
- Open a project in PIX4Dcloud that contains an Index map
- In the left panel, next to the Overlay layer, click
 .
. - Draw the Field polygon directly on the map.
- (Optional) Edit the polygon to better match the area of interest. For more information, see How to delete a line or polygon vertex on PIX4Dcloud.
- (Optional) In the right panel, define the Name, Description, and Tags, and adjust the following settings:
- Opacity: Controls the transparency of the Field layer.
- Histogram: Sets the lower and upper bounds for the index value histogram.
How to add a Field boundary
A Field boundary represents a subarea (parcel) within a Field. Multiple boundaries can be grouped under the same Field when they share common characteristics.
To add a Field boundary:
- Open a project in PIX4Dcloud with an Index map.
- In the left panel, select the relevant Field.
- Add a Field boundary using one of the following options:
- In the Annotation layer, click Add Field boundary. [1], or
- In the Field layer, click Add Field boundary.
 [2], or
 - In the 2D view, click the Add Field boundary tool. [3].
-
Navigate, zoom, and orient the map to locate the area of interest.
-
Draw the Field boundary polygon on the map.
-
(Optional) In the right panel, define the Name, Description, and Tags, and adjust the color of the boundary.
The Field boundary annotation displays the 2D area and 2D perimeter of the selected parcel.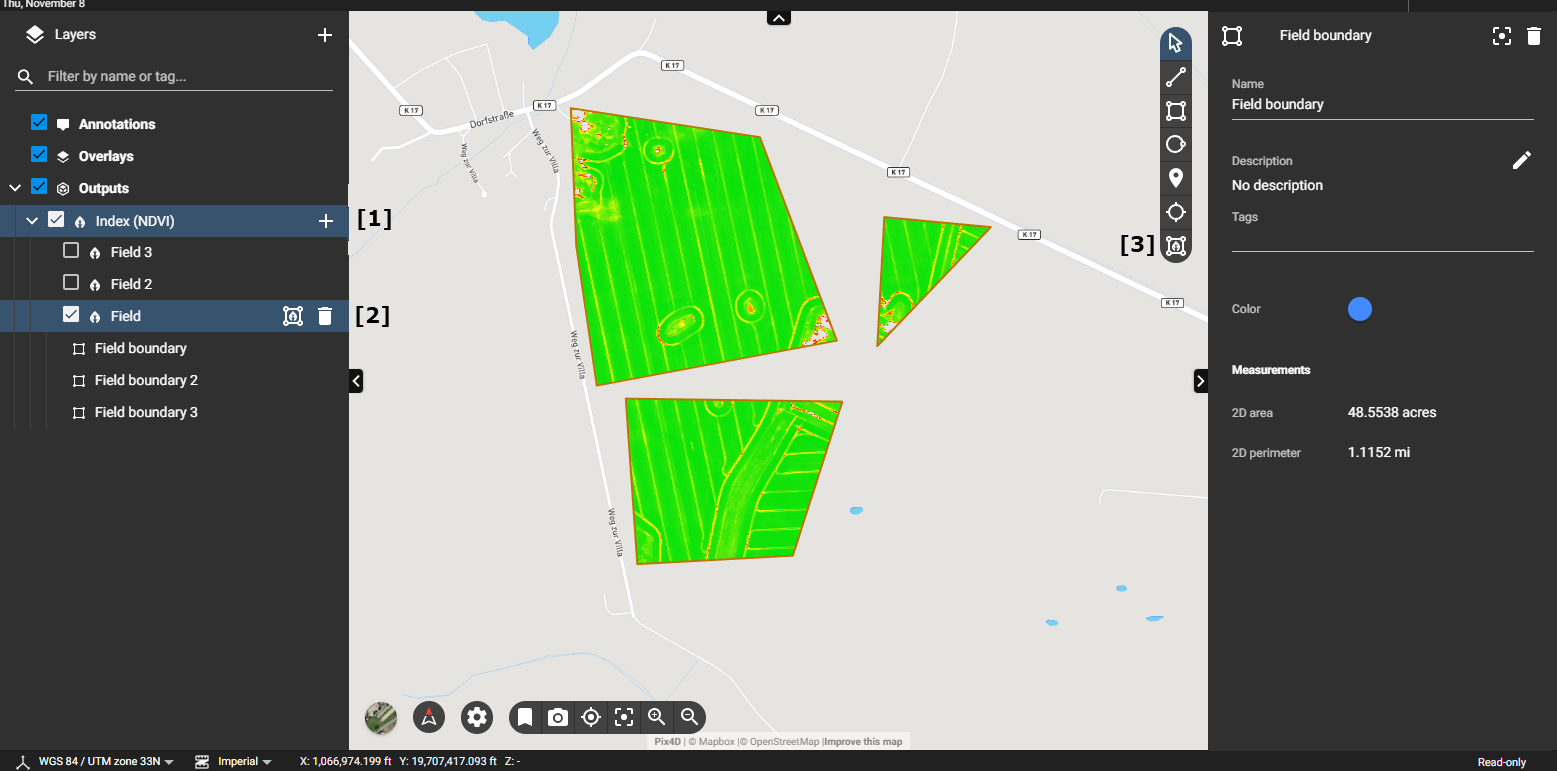
-
A single Field can contain multiple Field boundaries.
-
Changes to the histogram bounds of a Field are applied to all associated Field boundaries simultaneously.