IN THIS ARTICLE
What is a densified point cloud?
What is a 3D texture mesh?
What is an orthomosaic?
What is a reflectance map?
What is a DSM?
What is a DTM?
What is an index map?
What is a Gaussian Splat Model?
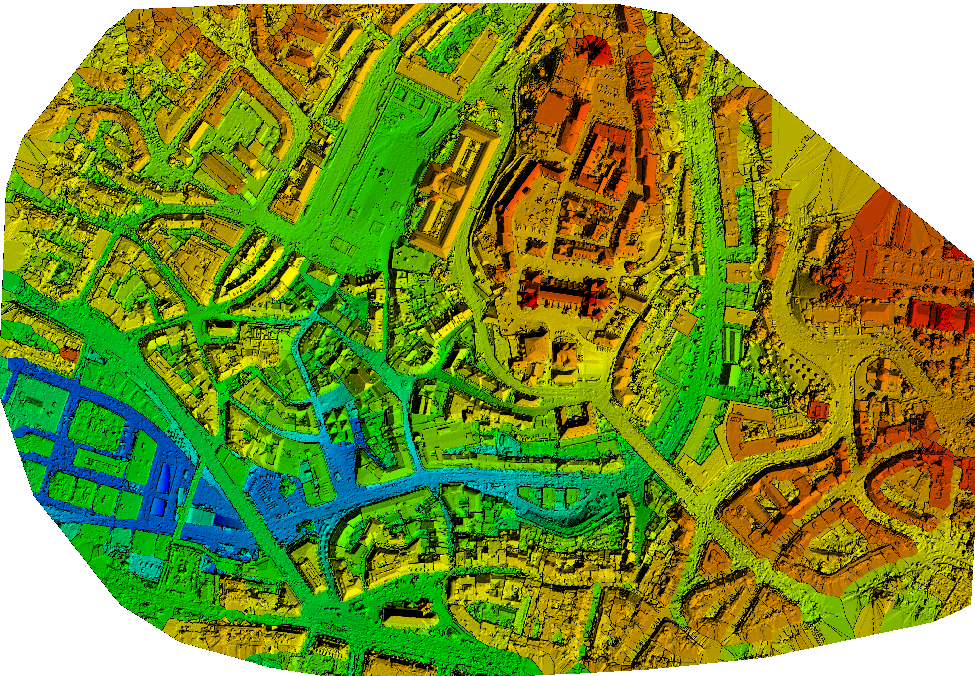
What is a densified point cloud?
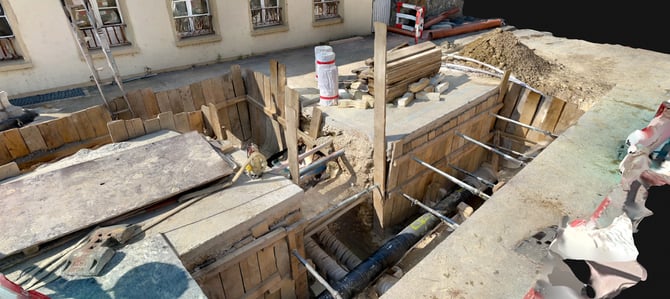
The densified point cloud is a set of 3D points that reconstruct the model. The X,Y,Z position and the color information is stored for each point of the densified point cloud.
The densified point cloud is computed based on the automatic tie points (ATPs) of step 1. Initial Processing. It provides a very accurate background for distance, surface, and volume measurements.
What is a 3D textured mesh?
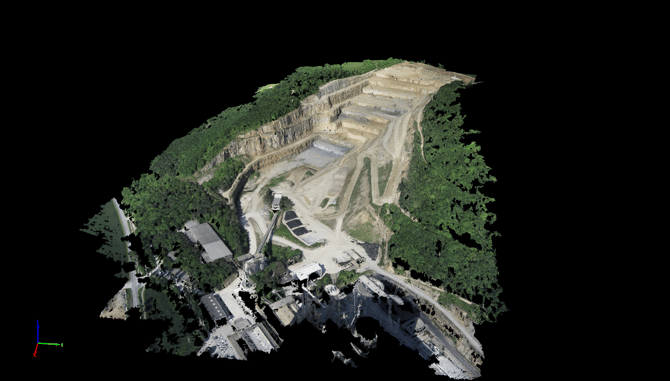
The 3D textured mesh is a representation of the model's shape. It consists of vertices, edges, faces, and the texture from the images that are projected on it.
It is useful to present, visualize, upload, and share the model on online platforms. It is intended to look nice more than to be accurate, so it is not recommended to use it for measurements.
What is an orthomosaic?
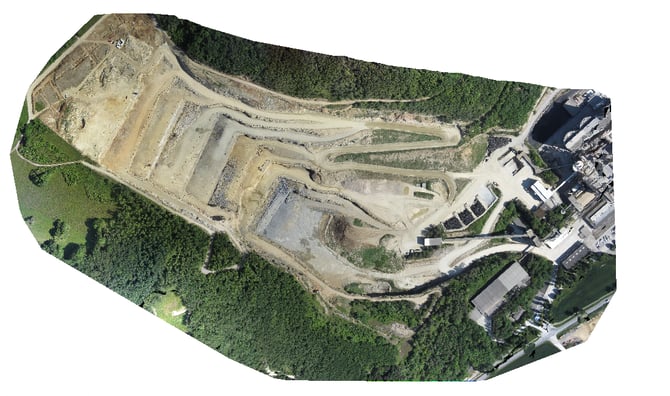
The orthomosaic is a 2D map. Each point contains X, Y, and color information. The orthomosaic has a uniform scale and can be used for 2D measurements (distance, surface). It corrects the following problems of the input images:
- The perspective of the camera.
- Different scale based on the distance that each point of the object/ground has from the camera.
The orthomosaic generation is different from photo stitching. For more information: Photo stitching vs orthomosaic generation - PIX4Dmapper.
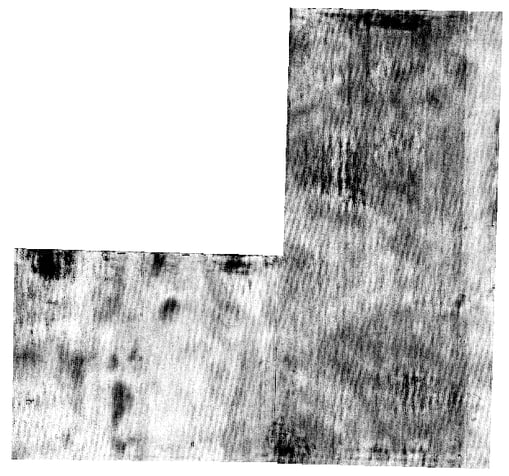
What is a reflectance map?
The reflectance map is mainly used when the input is multispectral/thermal imagery. For more information about the reflectance map vs. orthomosaic: Reflectance map vs orthomosaic.
For each band, one reflectance map is produced. The goal is to properly assess the reflectance for a particular feature based on the pixel value in the images. This pixel value is influenced by many factors, including but not limited to:
- Incoming light.
- ISO.
- Aperture.
- Shutter speed.
- Sensor response and optical system.
- Vignetting.
Therefore,the camera positions and the reconstructed model are used to take these different factors into account and produce an accurate reflectance map. To obtain representative results, it is important to have the right equipment. For Pix4D's recommendations concerning camera requirements: Camera Requirements for Precision Agriculture.
Note: Only PIX4Dmapper and PIX4Dfields can generate reflectance maps.

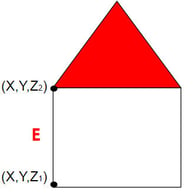
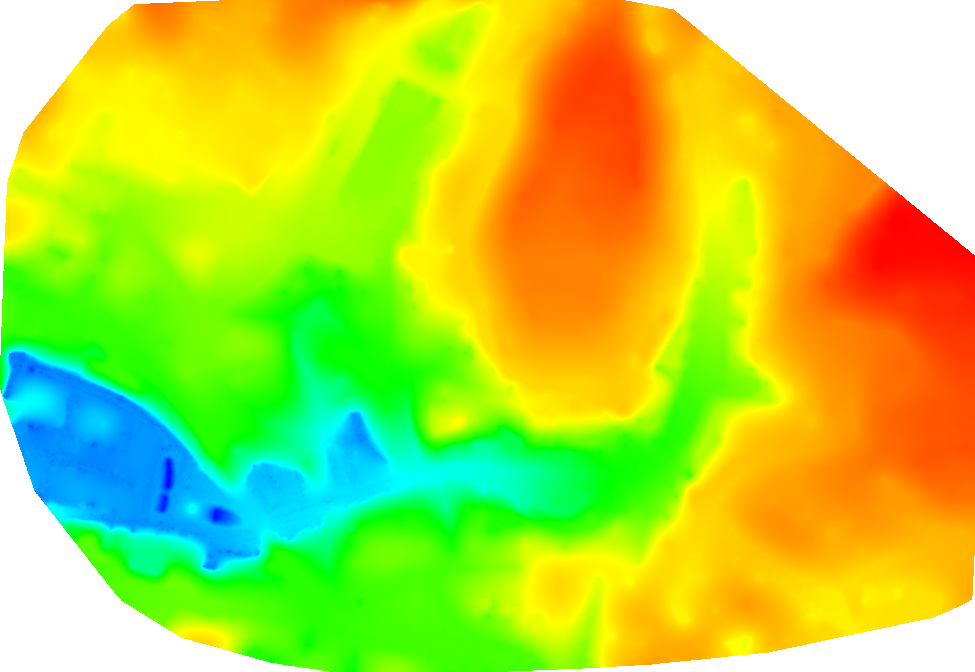
What is a DSM?
The digital surface model (DSM) is a 2.5 D model of the mapped area. It can be exported as two different types of files:
- Raster GeoTIFF.
- Point cloud (.xyz, .las, .laz).
Each pixel of the raster geotiff file and each point of the point cloud contain (X, Y, Z) information. They do not contain color information.

For each (X, Y) position, the DSM has only 1 Z value (the altitude of the highest point for this (X, Y) position). This is why it is considered to be a 2.5D model.

What is a DTM?
The digital terrain model (DTM) is a 2.5 D model of the mapped area after filtering out the objects, like buildings. It can be exported in GeoTIFF raster file format.
Each pixel of the raster file contains (X,Y, Z) information but they do not contain color information.
What is an index map?
PIX4Dmapper and PIx4Dfields generate several well-known indices, such as NDVI, as well as custom indices.
Each index is associated with an index map. For each pixel on this map, the pixel's value is derived from the associated reflectance maps.
- Pixel value in the red reflectance map: 0.4.
- Pixel value in the NIR reflectance map: 0.6.
- Pixel value in the green reflectance map: 0.1.
What is a Gaussian Splat Model?
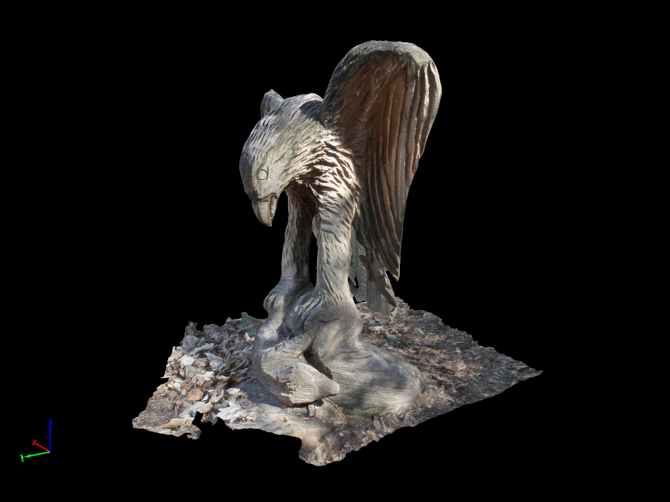
Gaussian Splatting is a technique used to enhance the visual quality of 3D outputs, such as point clouds and 3D textured meshes, by producing a highly photorealistic representation of a scene.
In this approach, the scene is represented by millions of particles, known as Gaussians, each defined by attributes such as position, orientation, scale, opacity, and color.
The process begins with an initial photogrammetric workflow, which calibrates the images and generates an initial point cloud. Each point in this point cloud is converted into a Gaussian, resulting in an enhanced point cloud that ultimately leads to a more accurate and visually appealing point cloud and 3D textured mesh than traditional photogrammetric methods.
More information: Using PIX4Dcatch to generate a Gaussian Splat model