PIX4Dcloud generates a quality report that can be used to get an overview of the project and assess its accuracy and quality.
- Go to Files & Reports > Results to display the list of downloadable items.
- Click Download on the quality report.
IN THIS ARTICLE
- Input summary
- Quality Check
- Ground Control Points
- 3D Checkpoints
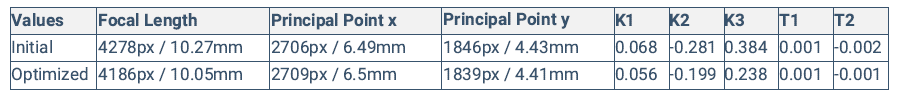
- Internal Camera Parameters
- Initial and Optimized Camera Positions with Capture Paths
- Initial and Optimized Camera Positions with Links
- 2D Keypoint matches
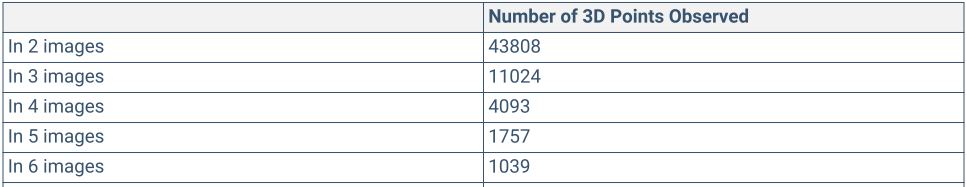
- 3D Points from 2D Keypoint Matches
- Absolute Geolocation Variance
- Absolute Orientation Variances
Number of images that have been calibrated, i.e., the number of images that have been used for the reconstruction of the model.
- Text highlighted in green: More than 95% of images are calibrated.
- Text highlighted in orange: Between 65% and 95% of images are calibrated.
- Text highlighted in red: Less than 65% of images are calibrated.
Perspective lens: The percentage of difference between the initial and optimized focal length.
- Text highlighted in green:
- Perspective lens: The percentage of the difference between initial and optimized focal length is less than 1%.
- Text highlighted in orange:
- Perspective lens: The percentage of the difference between initial and optimized focal length is between 1% and 5%.
- Text highlighted in red:
- Perspective lens: The percentage of the difference between initial and optimized focal length is equal/or more than 5%.Failed Processing Report: always displayed as the information is not available.
The median of matches per calibrated image.
- Text highlighted in green:
- More than 1,000 matches have been computed per calibrated image.
- Text highlighted in orange:
- Between 100 and 1,000 matches have been computed per calibrated image.
- Text highlighted in red:
- Less than 100 matches have been computed per calibrated image.
The median of keypoints per image. Keypoints are characteristic points that can be detected in the images.
- Text highlighted in green:
- More than 10,000 keypoints have been extracted per image.
- Text highlighted in orange:
- Between 500 and 10,000 keypoints have been extracted per image.
- Text highlighted in red:
- Less than 500 keypoints have been extracted per image.
error [px]
error [px]
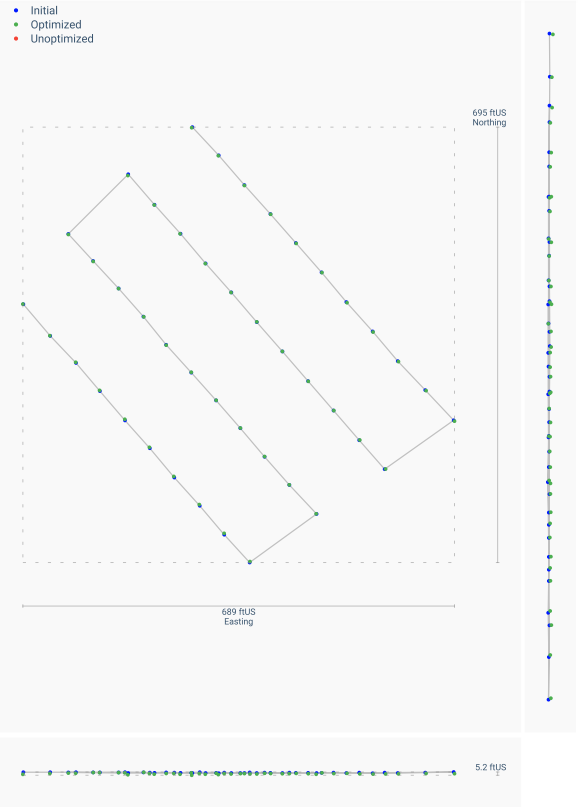
Blue - Indicates the initial position of a camera as extracted from the image EXIF.
Green - Indicates a computed position of a camera after the calibration step has been completed.
Red - Uncalibrated camera position (failed to calibrate).
The line represents the shortest path traveled by the camera between each consecutive image.
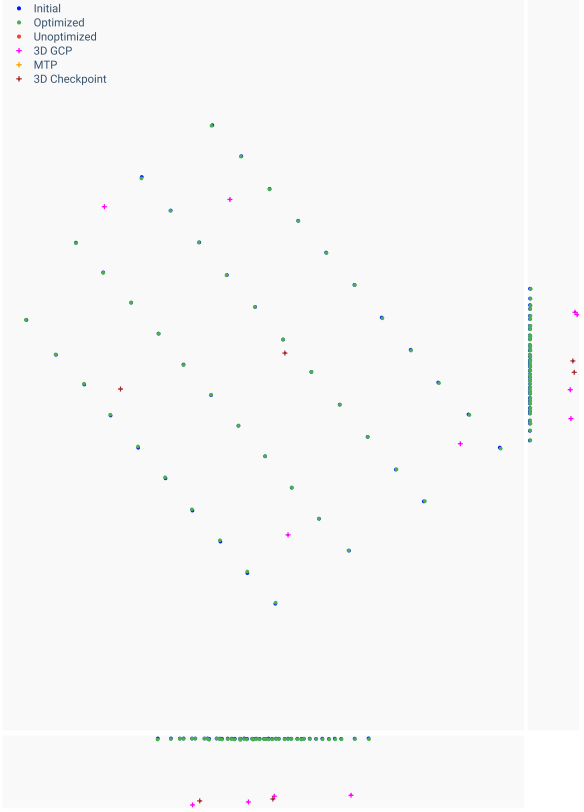
Blue - Indicates the initial position of a camera as extracted from the image EXIF.
Green - Indicates a computed position of a camera after the calibration step has been completed.
Red - Uncalibrated camera position (failed to calibrate).
Purple - GCPs' optimized positions.
Brown - 3D checkpoints' optimized positions.
The line represents the relationship between each image's initial and optimized position.
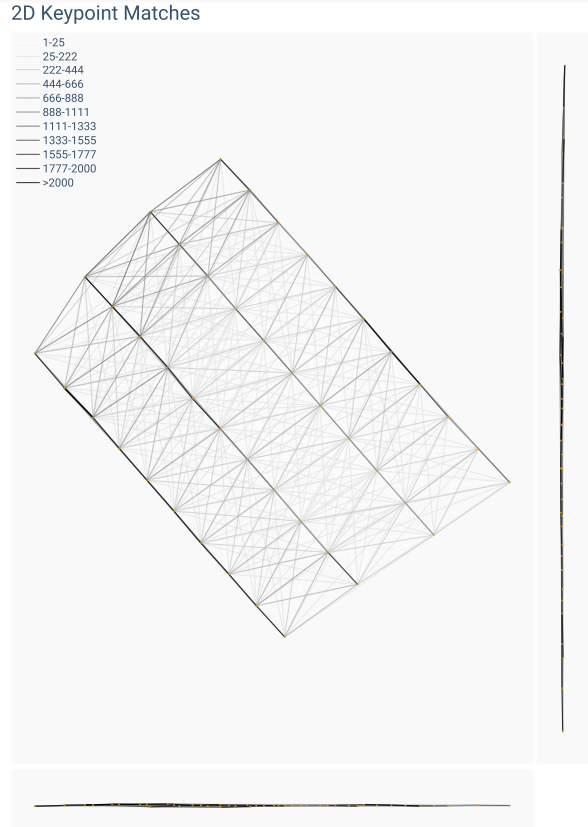
The weight of the links indicates the number of matched 2D keypoints between each pair of images. Lighter links indicate fewer matches, and darker links correspond with more matches.
Min Error and Max Error represent geolocation error intervals between -1000 and 1000 on the project unit of measurement.
Geolocation Error X, Y, Z show the percentage of images with geolocation errors within the predefined error intervals. The geolocation error is the difference between the initial and optimized image positions. Note that the image geolocation errors do not correspond to the accuracy of the reconstructions.
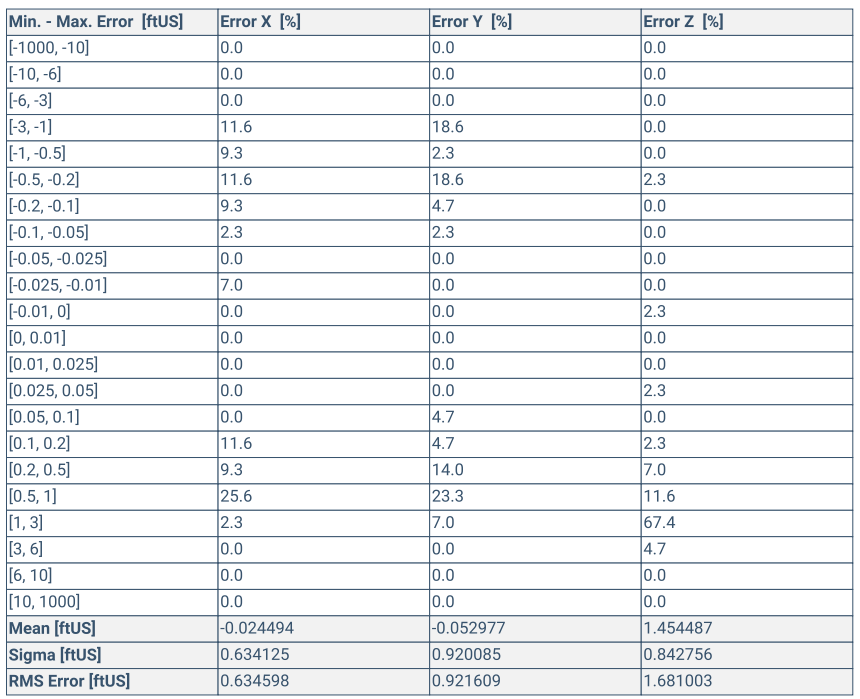
Min Error [project units] / Max Error [project units]
The percentage of images with geolocation errors in the X direction within the predefined error intervals. The geolocation error is the difference between the camera's initial geolocations and their computed positions.
Root mean square error of the image orientation. It is the difference between the initial image orientation and the optimized orientation. Note that the image orientation errors do not correspond to the accuracy of the reconstructions.
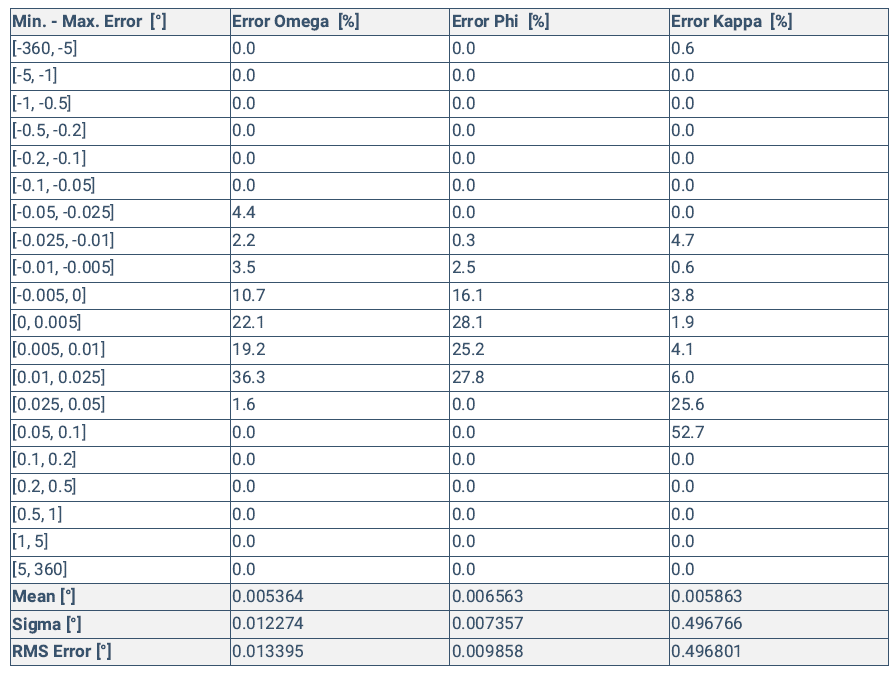
Min Error [degrees] / Max Error [degrees]
The proportion of images in the dataset with an orientation error that is within the defined range of degrees.