Volume can now be computed directly in PIX4Dcatch using the volume tool. This tool measures the volume between a base surface, defined by a boundary polygon, and the acquired point cloud.
Users only need to capture the area containing the volume of interest. With minimal manual input, the volume can be computed within minutes, allowing quick results and on-site feedback.
Compute Volume - Steps
-
Capture the scene that contains the volume to be computed.
-
Select Volume Computation on the project view.
-
Define the base of the volume by manually adding points.
-
Compute the volume.
-
Export the results as a PDF report.
Compute Volume - Detailed Description
To compute a volume, click the Tools ![]() icon at the bottom of the screen and select Volume Computation
icon at the bottom of the screen and select Volume Computation![]() .
.


Important: This feature requires a PIX4Dcatch Professional license and a device with LIDAR camera.
Once selected Volume Computation, a densification process will be launched automatically to facilitate the entire workflow. This process can be canceled at any time by pressing the cancel button.

To compute the volume, it is necessary to define its base by simply clicking on the screen to add points.

Tip: For better accuracy, zoom inside the point cloud with two fingers and move around to find the best orientation to define the base of the volume.

Go back to the top view by clicking on the icon ![]()
To remove a point, tap on the icon![]() .
.

To change the location of a specific point, press on the point and drag and drop to the new location.
To delete a specific point, press on the point and drag and drop to the trash icon at the bottom of the screen.

To remove all the points created, tap on the icon ![]()

Any number of points can be added to accurately define the base of the volume. However, a minimum of three points is required to initiate the computation.

After the base is defined, select Compute to begin the volume calculation. A progress bar will appear during processing.

Once the computation is complete, the values of the volume(s) can be found on the dropdown list.

Tip: Two types of volume can be found: The cut volume representing the material to be removed, displayed in green (example of a stockpile), and the fill volume representing material to be added, displayed in purple (example of a hole).

Volume(s) can be deleted with the trash icon
Mesh volume is displayed on the point cloud.
Tip: For improved visualization of the computed volume, disable the point cloud by selecting the mesh icon.![]() .
.

On each volume, an uncertainty is computed and displayed.
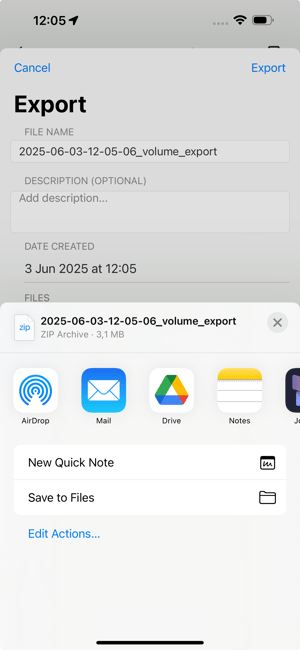
Export the results in a PDF report or .csv file by clicking Save.

Select where to store the file.

Once the volume is computed, a layer containing the volume measurements will be generated and the values will be displayed. This layer can be toggled on or off as needed.
The volume measurements can be exported as a PDF or CSV file by selecting the export icon![]() .
.


Volume uncertainty
Volume measurements are reported with an uncertainty that can be read as computed volume +/- uncertainty. This means that the volume is estimated to lie in the [volume-uncertainty, volume+uncertainty] interval with a confidence of about 68%. For confidences of 95% and 99%, the estimated intervals are respectively [volume-2*uncertainty, volume+2*uncertainty] and [volume-3*uncertainty, volume+3*uncertainty].
The uncertainty estimation is based on a theoretical model, which accounts for different sources of uncertainty, such as the point cloud noise, completeness and density. The model does not take scale errors (which can be prevented using an RTK receiver) or errors in the base surface into account. An extensive validation of the theoretical model has been carried out by running experiments on various types of objects.
Note: For more information visit the Volume computation tool full article
Volume Confidence with Uncertainty Volume Mesh
Understanding the Uncertainty Volume Mesh
The Uncertainty Volume Mesh provides a visual representation of the confidence levels for each point in the computed 3D volume. These confidence levels indicate the reliability of the volume data, helping users evaluate the accuracy of the measurements. Confidence is expressed as a value between 0 and 1:
- 1 (High Confidence): Highly reliable data.
- 0 (Low Confidence): Data that may lack accuracy.
The confidence values are visually represented using a color-coded legend, which allows for quick identification of areas with varying levels of certainty.

Color-Coded Legend for Confidence Levels
The uncertainty mesh uses colors to display the confidence levels:
 Red: Lowest confidence values, representing areas with significant uncertainty.
 Yellow: Somewhat low confidence, indicating moderate reliability.
 Green: Moderate confidence, showing acceptable data quality.
 Blue: Highest confidence values, marking areas of excellent data quality.


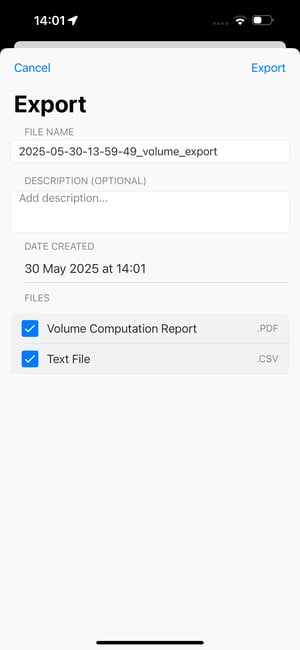
PDF Report - Generation
Export the results as a PDF report
Editable report information:
-
File name: The default name can be modified or replaced with a custom name.
-
Description (optional): A description can be added prior to exporting the report.
-
Date created: Fixed value of the creation of the report
Press Export
Select the location of the file
Back to the captured point cloud view
PDF Report - Details

PDF Report Contents
The first page of the PDF report includes the following information:
-
File name.
-
Date created.
-
Description.
-
Version of the PIX4Dcatch application used for computation.
This is followed by one or two additional pages, depending on the number of volumes computed.

For each volume type (cut and/or fill volume):
-
Computed volume value with associated uncertainty.
-
3D area value, including the 3D coordinates of the points defining the base.
-
3D perimeter value, including the 3D coordinates of the points defining the base.
-
A 3D view of the volume.
-
A top-view of the volume.
Best practices for Accurate Volume Measurement
Capture the full dimensions of your object
-
Ensure the entire object is captured, including both the top and bottom surfaces, to calculate the correct volume.
-
Perform a closed-loop capture to improve spatial consistency.
-
Remove any unwanted surrounding objects before capture, if possible.
Obtain an accurate 3D model
- A precise point cloud is essential for reliable volume computation.
- Use Autotags to enhance the quality of the 3D reconstruction.
- To improve absolute accuracy, particularly in outdoor environments, use RTK rovers compatible with PIX4Dcatch.
Precisely define the base of the volume
-
Use multiple perspectives when drawing the base polygon.
-
Add sufficient points to ensure the base accurately matches the object's footprint.
-
Remove any point that appears to be incorrectly placed.