IN THIS ARTICLE
How it works
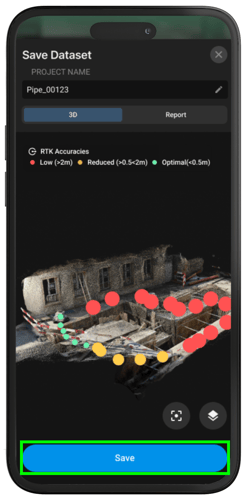
After completing a capture, a summary screen appears displaying:
- The project name
- Two tabs: 3D and Report
- The Save button

3D view
The 3D View tab displays all captured images along with their corresponding RTK/GPS measurement points.
If the project was captured using an RTK device, the following accuracy indicators are shown:
![]() Low: >6 cm
Low: >6 cm
![]() Reduced: 3-6 cm
Reduced: 3-6 cm
![]() Optimal: < 3 cm
Optimal: < 3 cm
Note: The thresholds vary depending on the GPS or RTK device.
Additional tools available in this view:
- Zoom icon
 : Centers the 3D model on the screen.
 - Layers icon
 : Expand to modify the point cloud and image layers.
 - Pencil icon
 : Edit the project name.
Report
The Report tab summarizes the quality of the capturebased on several several parameters. Each section provides key metrics and, where applicable, improvement tips.
.png?width=250&height=500&name=Plantilla%20Iphone%20(21).png)
Images
Displays the total number of images and the percentage of images with optimal quality.
Tips for improving image quality are shown at the bottom of the section.
.png?width=250&height=268&name=Frame%20(1).png)
Geolocation
Shows the geolocation source used during capture:
 NO LOCATION: No geolocation information was acquired for the images.
 GPS: The images were captured using the device’s integrated GPS receiver, providing low positional accuracy.
 RTK: The images were captured using an RTK receiver, providing high positional accuracy.
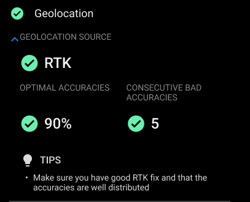
When working with RTK accuracy, the parameters are divided into two subcategories: Optimal accuracies and Consecutive bad accuracies.
Optimal accuracies are split into three ranges:
- optimal 90-100%
 reduced 50-90%
- low 0-50%
Consecutive bad accuracies are split into two ranges:
- Optimal 0-50 accuracy samples
- Reduced +50 accuracy samples
.png?width=250&height=340&name=Frame%20(2).png)
Autotags
Displays the number of Autotags detected, along with the number of GCPs (if applicable) and how many were successfully recognized.
- A green check indicates all GCPs were recognized.
- A red icon indicates that some GCPs were not recognized.
.png?width=250&height=258&name=Frame%202608747%20(2).png)
.png?width=250&height=258&name=Frame%202608747%20(3).png)
Annotations
Indicates the number of annotations.
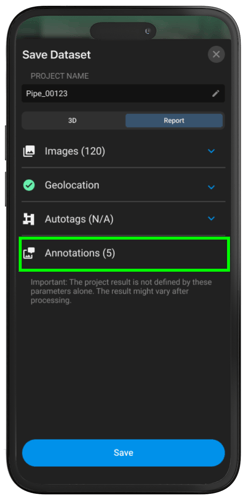
Saving the Project
If all parameters meet the quality requirements of the project, tap Save to save the project. If the parameters do not meet the requirements, you can return to continue capturing, or abandon, the project by tapping the ![]() close button.
close button.