
Disclaimer: PIX4D provides instructions for third-party platforms and products solely as a helpful guide to unblock your integration. Those companies are independent of PIX4D. We do not maintain, control, or guarantee the performance, accuracy, or reliability of these products.
PIX4D may provide third-party links or contact information to help you find additional information about this topic. This contact information may change without notice. PIX4D does not guarantee the accuracy of third-party documentation or contact details.
Versions used for this guideline: PIX4Dmatic 2.9.0 and QGIS 4.0.3-Norrköping
When you open a DSM or thermal orthomosaic exported from PIX4Dmatic in QGIS, the minimum and maximum values shown in the layer statistics or color scale may not match the values shown in PIX4Dmatic.
For example:
- The minimum DSM elevation in QGIS may appear higher than the minimum value in PIX4Dmatic.
- The maximum temperature in a thermal orthomosaic may appear lower than the maximum value in PIX4Dmatic.
- The color scale may not display some extreme values, which can create apparent artifacts or differences in visualization.
This does not necessarily indicate a problem with the exported GeoTIFF. By default, QGIS may estimate the minimum and maximum values to calculate them faster. The estimated range may not include the complete range of pixel values.
How to open the DSM and thermal orthomosaic in QGIS
Once the DSM and thermal ortomosaic have been exported from PIX4Dmatic, the way to open them in QGIS are the foolowing:
- Draggind and dropping the files into the QGIS project
- Click Layer > Add Layer > Add Raster Layer (or use the shortcut
Ctrl + Shift + R).
Get the complete pixel range in QGIS
To display the true minimum and maximum pixel values, configure QGIS to calculate the actual range.
- In QGIS, right-click the DSM or thermal orthomosaic layer.
- Select Properties.
- Open the Symbology tab.
- Expand Min / Max Value Settings.
- Under Min / max options, select Min / max instead of Cumulative count cut.
- Under Accuracy, select Actual (slower) instead of Estimate (faster).
- Click Apply.
Important: The most important setting is Accuracy → Actual (slower). This instructs QGIS to calculate the range using the complete raster rather than an estimated range.
Expected result
After applying these settings, QGIS recalculates the raster statistics using the full pixel range. The minimum and maximum values should now be comparable to the values displayed in PIX4Dmatic, provided that:
- The same exported raster is being compared.
- No-data pixels are excluded consistently.
- The values are being viewed in the same units.
- The same area or region is being considered.
For DSMs
For a DSM, the minimum and maximum values represent elevation values stored in the raster. If QGIS uses an estimated range, the minimum elevation displayed in QGIS may be higher than the minimum elevation displayed in PIX4Dmatic, or the maximum may be lower.
Select Actual (slower) accuracy to make QGIS calculate the complete elevation range.
For thermal orthomosaics
For a thermal orthomosaic, the minimum and maximum values represent the temperature values stored in the raster. If QGIS uses estimated statistics, some of the lowest or highest temperature pixels may not be included in the displayed range.
Select Actual (slower) accuracy to calculate the complete temperature range before comparing the values with PIX4Dmatic.
For temperature conversion
Thermal orthomosaics are exported in Kelvin. Follow the procedure below to convert the values to the desired temperature unit.
In the toolbox, locate the Raster Calculator tool.
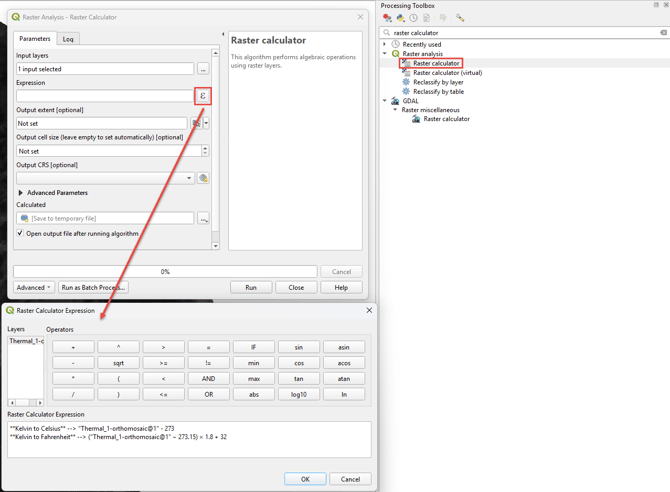
- Input layer. Select the orthomosaic layer
- Click in the ε symbol to open the Raster Calculator Expression window
- Depending on the conversion needed:
- Kelvin to Celsius --> "layer" - 273.15
- Kelvin to Fahrenheit --> ("layer" − 273.15) × 1.8 + 32
- Run the tool. As soon as the process finishes, a new file will appear in the layers section.
If the values still do not match
If the values remain different after recalculating the actual range:
- Confirm that you are comparing the same exported file.
- Check whether the DSM or thermal orthomosaic contains no-data areas.
- Confirm that the temperature or elevation units are the same in both applications.
- Verify whether the color scale is calculated for the entire layer or only for a selected region.
- Reopen the layer properties and confirm that Accuracy is still set to Actual (slower).