Once an Index layer is uploaded or generated directly in PIX4Dcloud, it is possible to add Field and Field boundaries to the project. This article explains how Fields and Field boundaries can be accessed and used as supporting tools to analyze multispectral data.
IN THIS ARTICLE
Information: The Field and Field boundary features are only available under these conditions:
- The project has been processed on PIX4Dcloud with an Ag Multispectral template.
- The project has been uploaded from PIX4Dfields to PIX4Dcloud with the share functionality.
How to add a Field
Field: Refers to a polygon that masks the NDVI image and shows the histogram of that specific area.
To add a Field:
- Open a project with an Index map.
- On the left panel, in correspondence with the Overlay layer, click
 .
. - On the map, draw the field shape.
- (Optional) Modify the polygon to fit better the shape of the field. For more information: How to delete a line or polygon vertex on PIX4Dcloud.
- (Optional) On the right panel, add Name, Description, and Tags. It is also possible to change the following settings:
- Opacity: the opacity of the layer.
- Histogram: set the lower and upper bounds of the histogram.
How to add a Field boundary
Field boundary: Refers to subareas (parcels) that can be grouped under the same Field since these parcels share common characteristics.
To add a Field boundary:
- Open a project with an Index map.
- On the left panel, select a Field.
- To add a Field boundary:
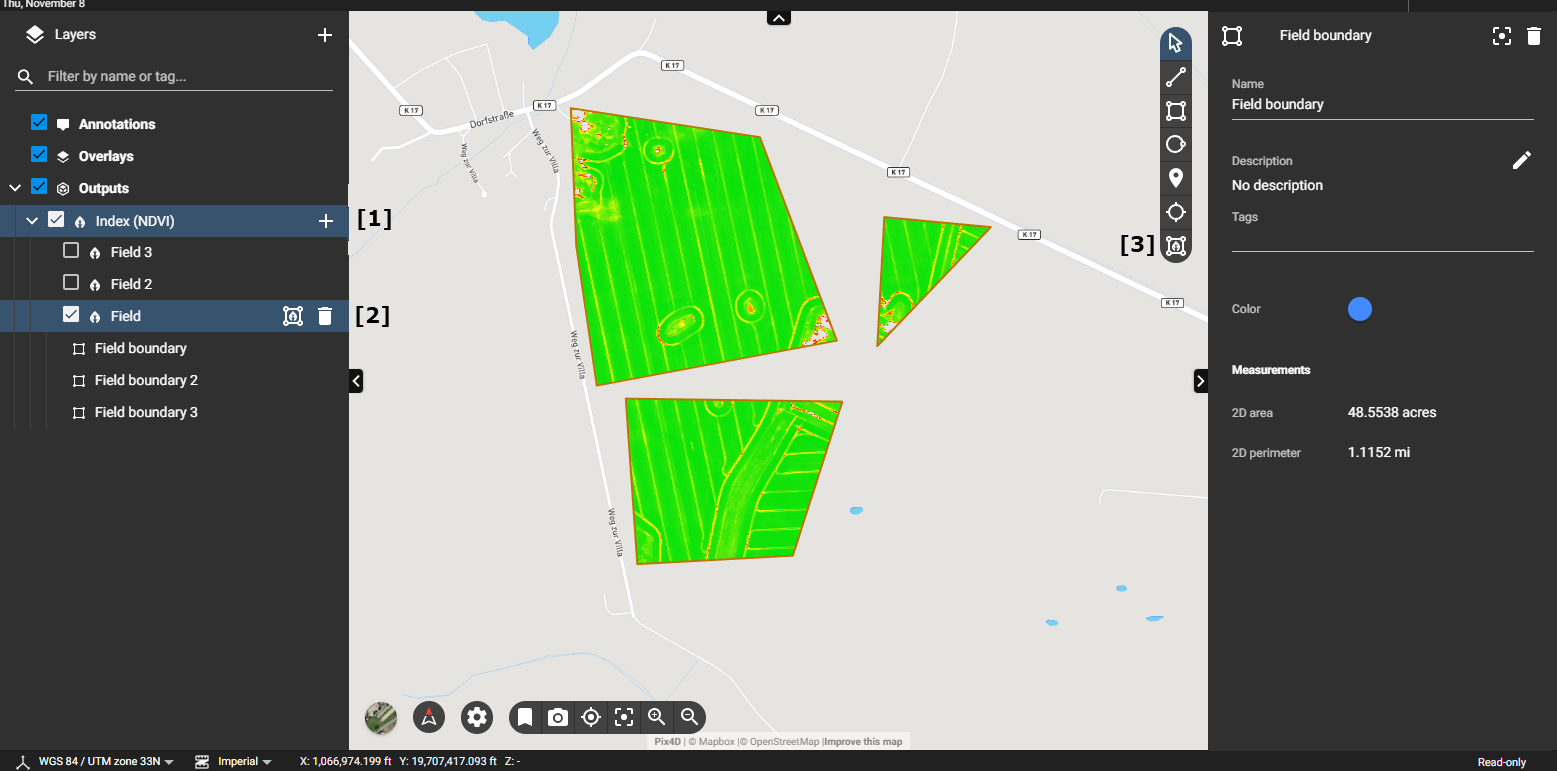
- On the left panel, in correspondence with the Annotation layer, click . Then select Add Field boundary [1], or
- On the left panel, in correspondence with the Field layer, click on
 [2], or
 - On the 2D view, click [3].
- On the left panel, in correspondence with the Annotation layer, click
- Navigate the map, zoom, and orient it to locate the area of interest.
- On the map, draw the Field boundary.
- The field boundary annotation shows the 2D area and 2D perimeter.
- (Optional) On the right panel, add Name, Description, and Tags. It is also possible to change the color of the shape.
Note:
- It is possible to have more than one Field boundary under a Field.
- If the bounds of the histogram for a specific Field change, this affects all the boundaries that belong to the Field simultaneously.