IN THIS ARTICLE
Exporting statistics
Annotation-statistics.csv
Layer-statistics.csv
How to open the .csv files
Exporting statistics
PIX4Dfields allows for annotation and raster layer statistics to be exported in a .CSV (comma separated values) format.
Process:
- Click Export.
- On the Export Menu, click
 Statistics.
 - Select the
 Layer/s where annotations are, choose decimal separator (comma or point).
 - Click Export, choose
 Folder of destination.

Two files will be exported:
- annotation-statistics: Calculates the zonal statistics within the annotation.
- layer-statistics: Calculates basic statistics of the entire raster layer.
Information: When setting a custom minimum and maximum value in the histogram, the following is exported:
- The statistics of the whole layer or the annotation area.
- The statistics of the visible values set with the histogram.
Important: When viewing the histogram, the "visible" statistics will be all the pixels with values between the min/max sliders.
Annotation-statistics.csv
This file contains statistics about each annotation or plot.
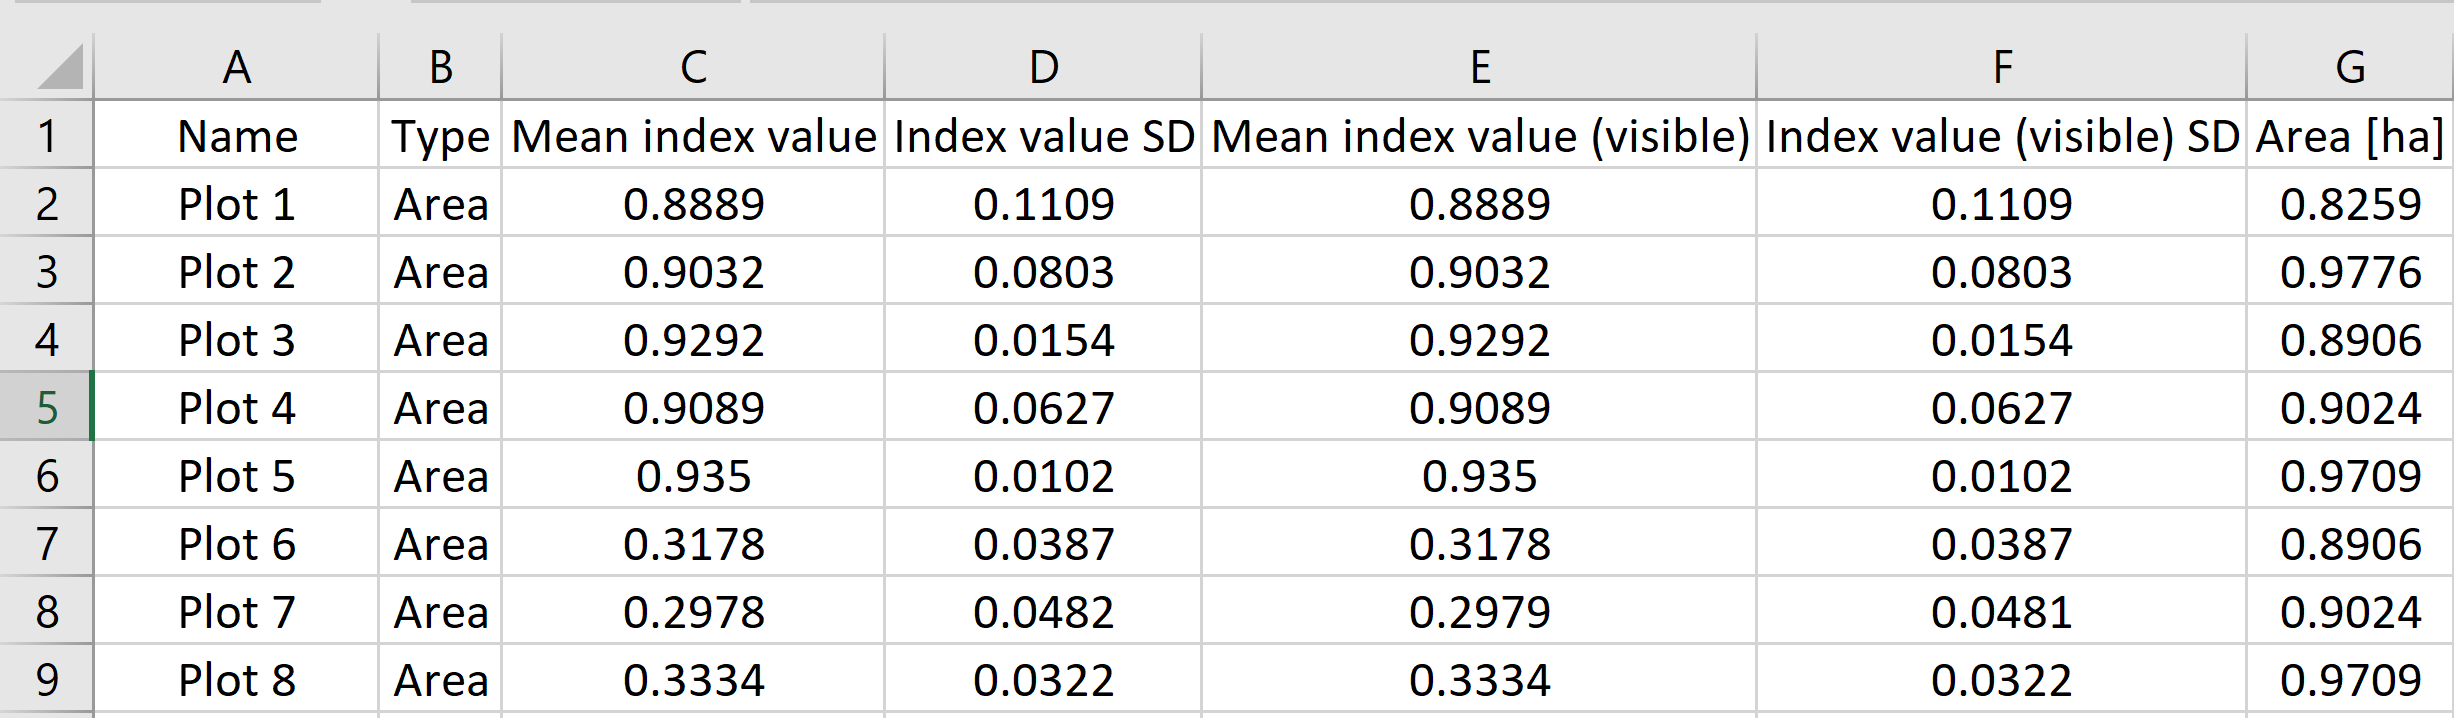
- Mean index value: Refers to the average value of the pixels inside every specific plot that has been calculated using the bands of the corresponding vegetation index.
- Index value SD: Refers to the Standard Deviation (SD), which describes how spread out the dataset is. It is a measure of the amount of variation or dispersion of the plot. A low SD indicates that the values tend to be close to the mean of the dataset, while a high SD indicates that the values are spread out over a wider range.
- Mean index value (visible): Refers to the average of the pixels inside each plot within the range selected in the histogram.
- Index value (visible) SD: Refers to the SD of data within the range selected in the histogram.
- Area: Refers to the surface covered by the plot and it does not take into account changes on the histogram range.
Layer-statistics.csv
This file contains statistics about the selected layers. The example below describes an NDRE index and Digital Surface Model.
![]()
- Area: Refers to the surface covered by the layer.
- Area (visible): Refers to the surface only covered by the pixels within the range selected in the histogram.
- Min-Max: Refers to the minimum and maximum values present on each layer.
- Min - Max (Visible): Refers to the minimum and maximum values within the range selected in the histogram for each layer.
- Mean index value: Refers to the average value of all pixels in the layer, that has been calculated using the bands of the corresponding vegetation index.
- Index value SD: Refers to the SD of data present in the whole layer.
- Mean Height: Refers to the average height present in the layer, it will be present if Digital Surface Model (DSM) was selected when exporting.
- Height SD: Refers to de SD of the DSM.
- Mean index value (visible): Refers to the average value of all pixels within the range selected in the histogram.
- Index value SD (visible): Refers to the SD of data within the range selected in the histogram.
- Mean height (visible): Refers to the average height value of all pixels within the range selected in the histogram.
- Height (visible) SD: Refers to the SD of height data within the range selected in the histogram.
How to open the .csv files
If the data appears garbled after double-clicking the .csv file, please follow the instructions below.
Microsoft Excel
- Open the Excel app.
- Click Data.
- Click from Text/CSV.

- Import the file.
- Under File origin, choose Unicode (UTF-8).
- Set Delimeter to Comma.
Google spreadsheets
- Click File, Import.
- The Import file menu appears
- Set separator type to Detect automatically.
- Activate Convert text to numbers, dates, and formulas.

- Click Import data.