

The Grid of points tool helps to automate the creation of spot elevations and allows for drastic simplification of the number of point cloud points. No new points are created, only existing points from the input data are used.
Three types are available
- The Regular grid is generated based on the selected sampling distance between points.
- The Low-pass grid is generated based on a filter working on the Z-range.
- The Smart grid creates points only where changes in terrain elevation occur.
- Click Process
 or,
or, - On the Menu bar, click Process > Grid of points or,
- On the Content panel, click TIN > Grid of points >
 .
.
IN THIS ARTICLE
Processing options
Input point cloud
Regular grid of point
Low-pass grid of point
Smart grid of point
Results
Export
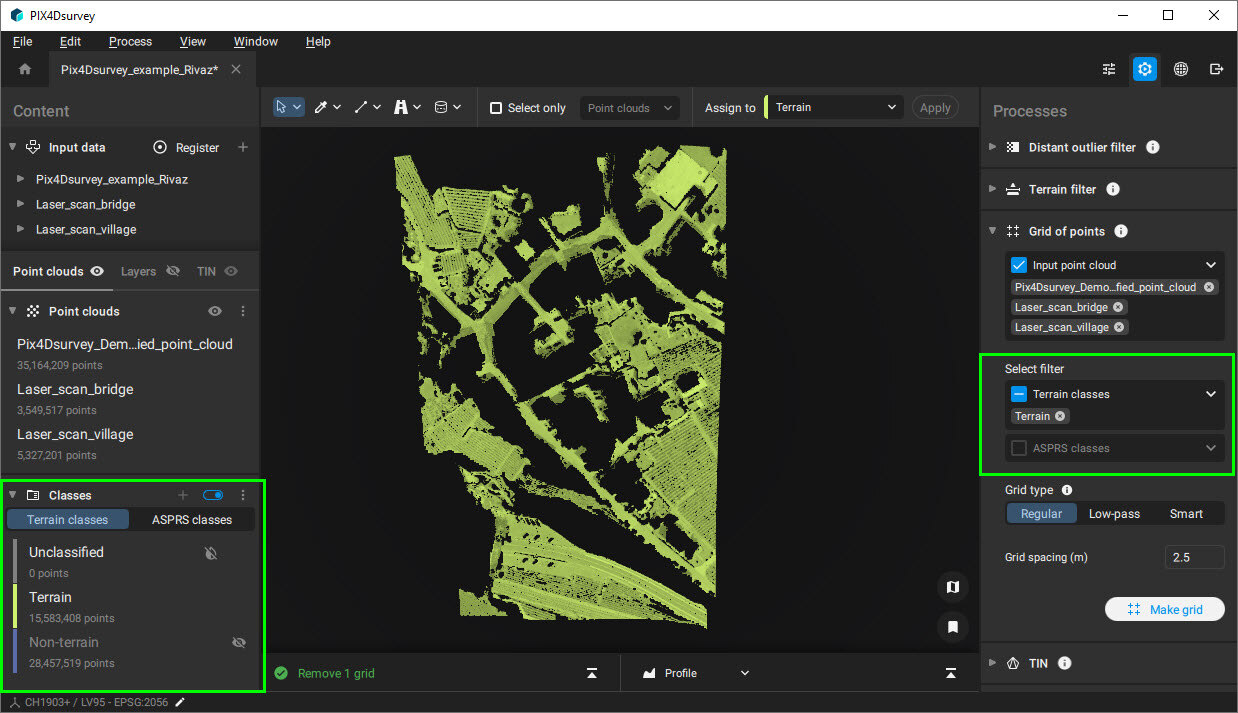
Processing options
Input point cloud
Defines the point clouds used for the Grid of points process:
- All: All point clouds in the Content > Point clouds are used for processing.
- Only visible - default. Only visible point clouds in the Content > Point clouds and Terrain classes are used for processing.
- Terrain - default if Terrain points are available: All points in the Terrain class are used for processing. Only available after the Terrain filter is processed.
- Non-terrain: All points in the Non-terrain class are used for processing. Only available after the Terrain filter is processed.
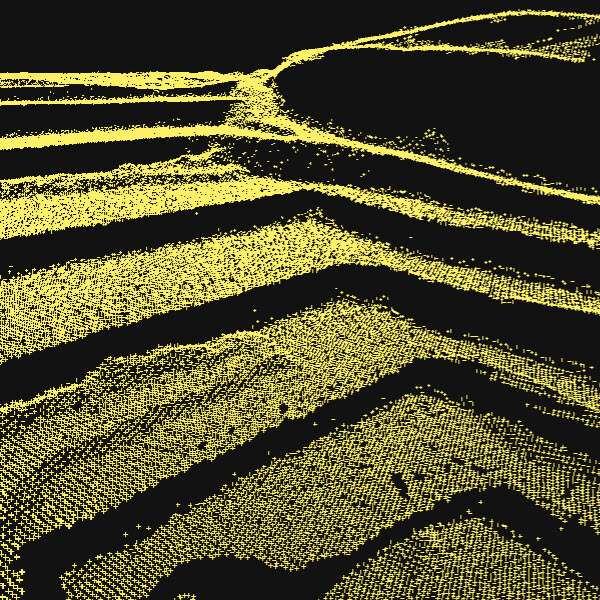
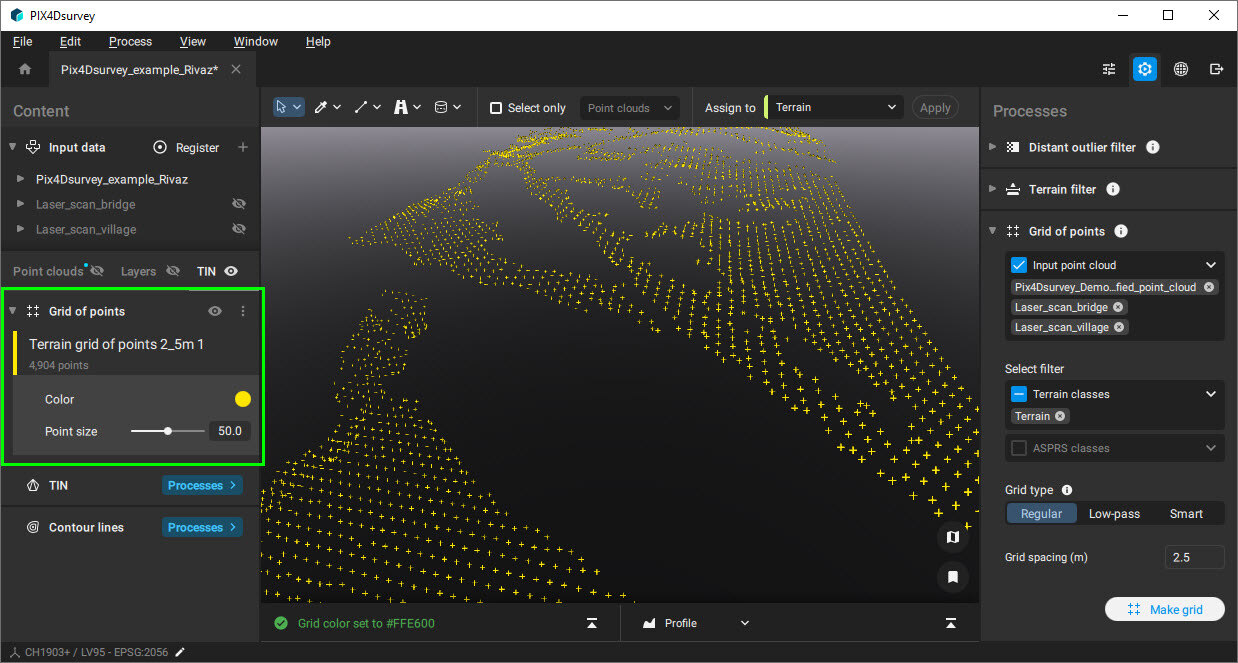
Regular grid of points
A Regular grid is a simple rectangular grid that is decimated based on the selected Sample distance between points.
- Grid spacing [units]: Determines the grid size:
- 0.1 m - 30 m, 2.5 m - default.
- 0.3 ft - 100 ft, 8 ft - default.
Low-pass grid of points
The low pass grid is generated based on the point cloud points within each cell based on the Grid spacing (sampling distance). Within the cell, the low pass looks at the vertical distribution and selects a point in the correct vertical slice.
- Grid spacing [units]: Determines the grid size:
- 0.1 m - 30 m, 2.5 m - default.
- 0.3 ft - 100 ft, 8 ft - default.
- Z-Range: Determines the altitude of the filter along the Z-axis.
- 0 - 10, 1 - default.
- Here’s what some example Z-Range values mean:
Value 0: Selects the absolute lowest point in each cell. This is highly sensitive to outliers, such as data errors or points in small ditches, and may not represent the true ground level.
Value 1 (Recommended for Terrain): Selects a point near the bottom of the elevation range but ignores the lowest 10% of points. This provides a much more stable and reliable estimate of the true ground surface by filtering out potential noise.
Value 5 (Median): Selects the point halfway up the vertical distribution of points in the cell. In an area with a bush, for example, this point would likely be located in the middle of the bush.
Value 9: Selects a point near the top of the elevation range, which is useful for modeling features like the top of a forest canopy.
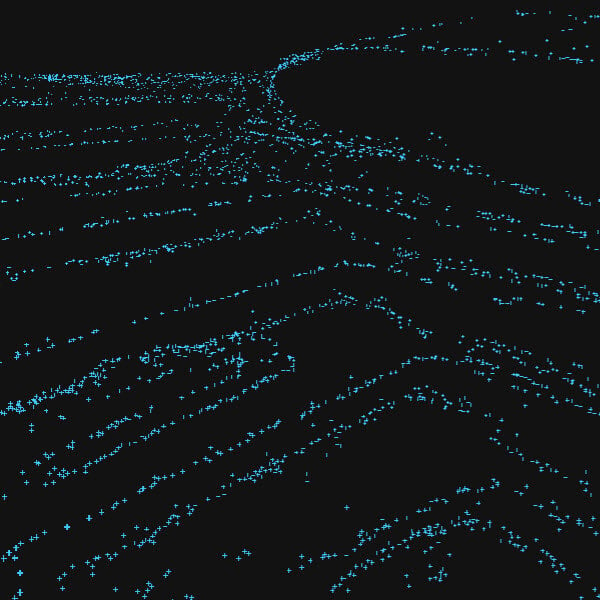
Smart grid of points
A Smart grid attempts to generate just the most important points that define the terrain.
Based on the grid spacing, the number of grid points, and elevation variations the algorithm avoids creating redundant points on planar areas and focuses on generating points only where changes in terrain occur.
The following parameters can be adjusted:
- Minimum grid spacing [units]: The initial grid spacing that is used as a starting point for finding the most important points.
- 0.1 m - 30 m, 2.5 m - default.
- 0.3 ft - 100 ft, 8 ft - default.
- Z-Range: Determines the altitude of the filter along the Z.
- 0 - 10, 1 - default.
- Maximum number of grid points: The maximum possible number of grid points in the final result.
- 3 - 1000000, 1000 - default
- Maximum elevation variation [units]: The maximum elevation variation from neighboring points.
- 0.01 m - 5 m, 0.05 m - default
- 0.03 ft - 16 ft, 0.15 ft - default
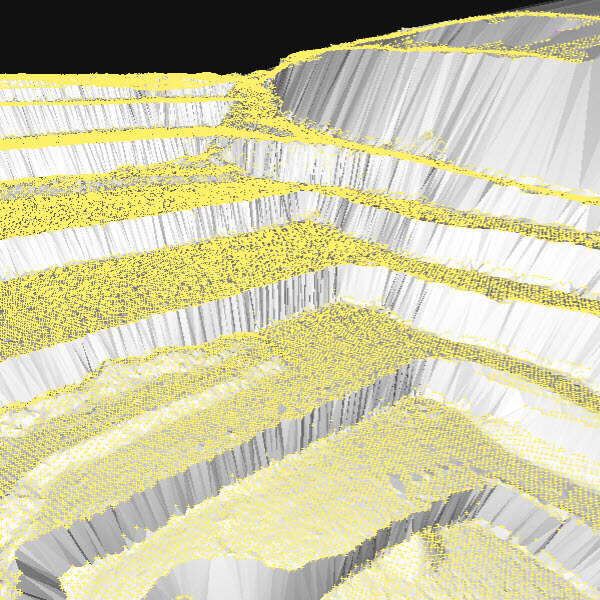
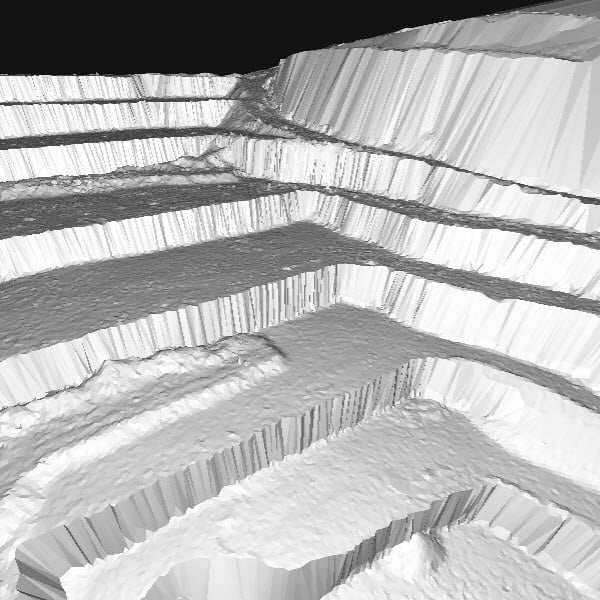
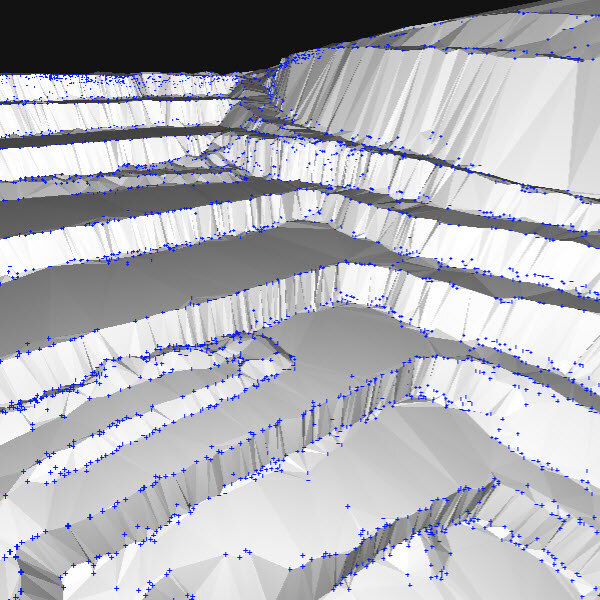
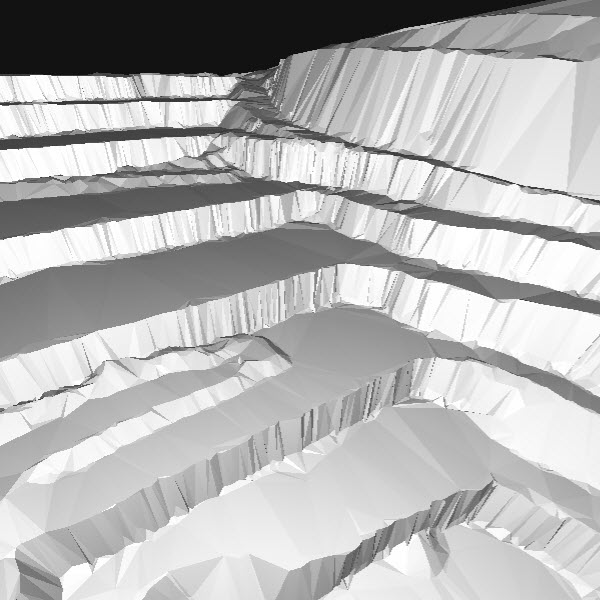
Results
Export
The result of the Grid of Points process can be exported in .dxf, .shp, .zip (.shp), geojson, .csv, .las, and .laz format. More in the Export article.
If the .csv format is selected, it is possible to select among the following column formats:
| Format | Meaning |
| PENZD | Point name, Easting coordinate, Northing coordinate, Z coordinate, Description |
| PNEZD | Point name, Northing coordinate, Easthing coordinate, Z coordinate, Description |
| PXYZD | Point name, X coordinate, Y coordinate, Z coordinate, Description |
| PYXZD | Point name, Y coordinate, X coordinate, Z coordinate, Description |
| PENZL | Point name, Easting coordinate, Northing coordinate, Z coordinate, Label |
| PNEZL | Point name, Northing coordinate, Easthing coordinate, Z coordinate, Label |
| PXYZL | Point name, X coordinate, Y coordinate, Z coordinate, Label |
| PYXZL | Point name, Y coordinate, X coordinate, Z coordinate, Label |
| PENZ | Point name, Easting coordinate, Northing coordinate, Z coordinate |
| PNEZ | Point name, Northing coordinate, Easthing coordinate, Z coordinate |
| PXYZ | Point name, X coordinate, Y coordinate, Z coordinate |
| PYXZ | Point name, Y coordinate, X coordinate, Z coordinate |
| ENZ | Easting coordinate, Northing coordinate, Z coordinate |
| NEZ | Northing coordinate, Easthing coordinate, Z coordinate |
| XYZ | X coordinate, Y coordinate, Z coordinate |
| YXZ | Y coordinate, X coordinate, Z coordinate |
Use the  Include column headers checkbox to include the column headers to the columns in the .csv file.