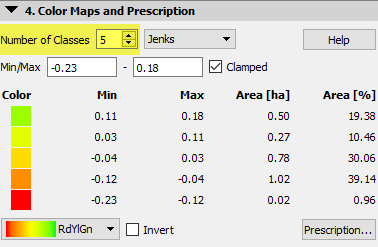
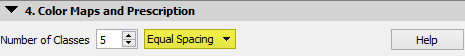
In section 4. Color Maps and Prescription it is possible to adjust different parameters.
Change the Number of Classes
The number of Classes can be set from a minimum of 2 to a maximum of 32.
By default, the Number of Classes is set to 5.
- Increase/decrease the number of Classes by pressing on the arrows
-
 Increase the number of Classes.
 -
 Decrease the number of Classes.
-
- Enter the number of Classes directly
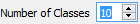 Input the number (from 2 to 32) with the keyboard.
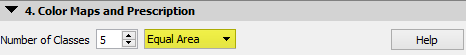
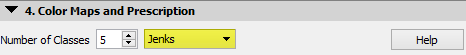
Select the classifying method from the drop-down list
There are three ways of splitting the classes:
- Equal Area,
- Equal Spacing,
- Jenks.
By default, the Equal Area method is selected.
Equal Area
When Equal Area is selected, the classes are defined by the area that each index value interval occupies.
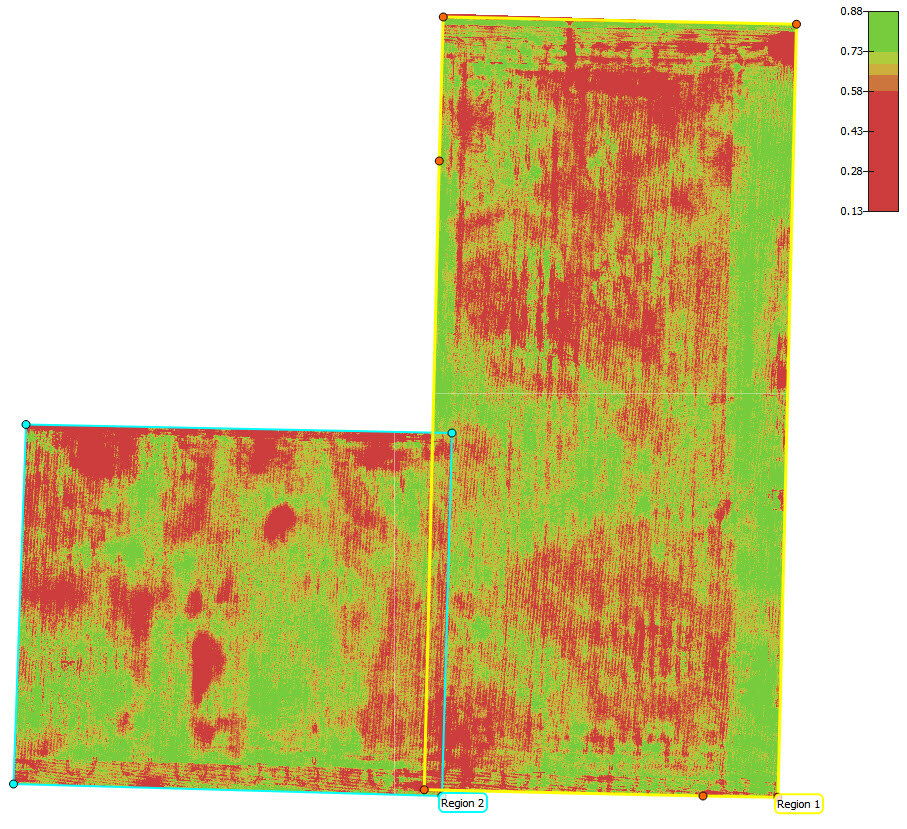
Equal Spacing
The intervals are divided equally within the min/max range when Equal Spacing is selected.
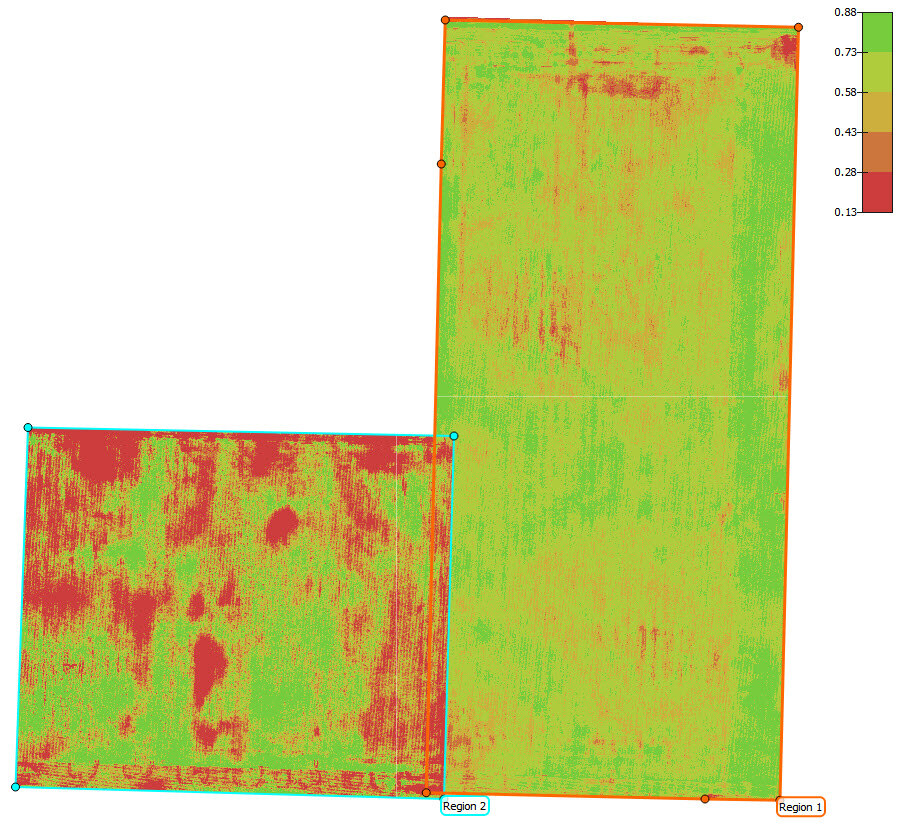
Jenks
When Jenks is selected, intervals are divided using the Jenks natural breaks optimization method. For more information: Wikipedia.
Enter the minimum and maximum index values to set a range
The Min/Max values are not the same as the reflectance maps' minimum/maximum values. By default, the software will cut off the outliers on the edge of the histogram. The values can still be modified if needed.
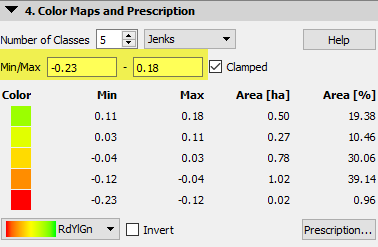
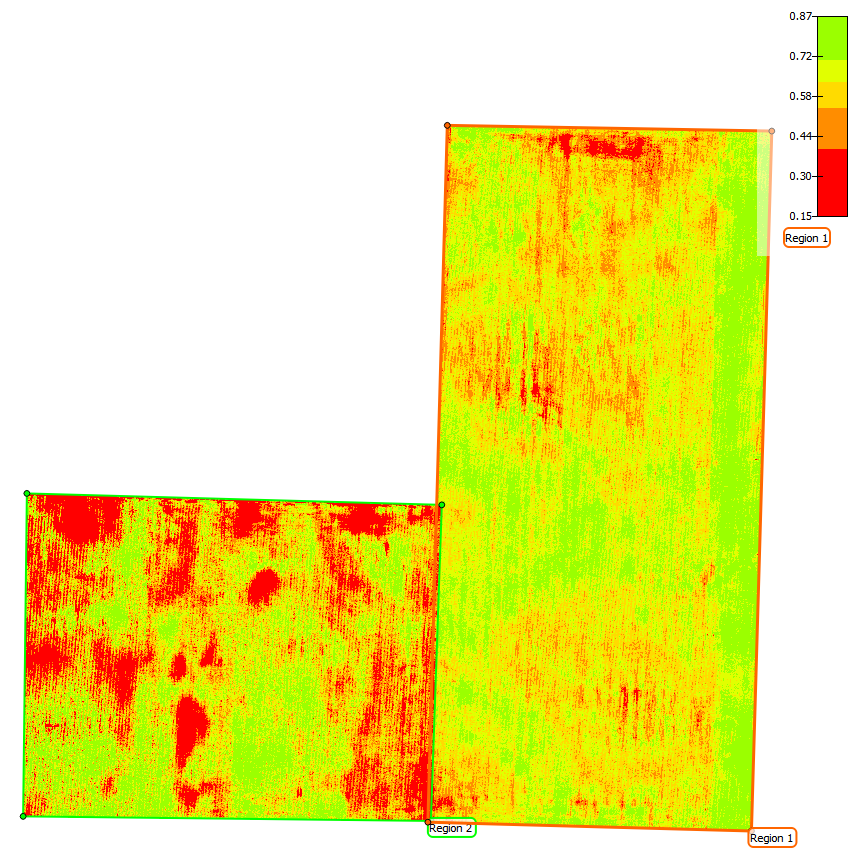
- To display the pixels that have an index value outside the selected range (Min/Max) with the color of the minimum or maximum selected index values, select the Clamped box.
- To display the pixels with an index value outside the selected range (Min/Max) with transparency, deselect the Clamped box.
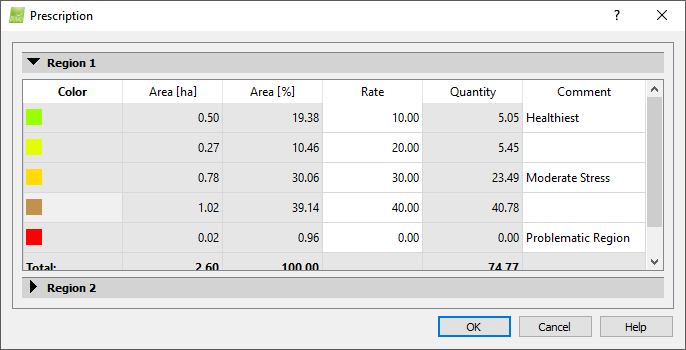
Enter the Prescriptions of each Class
- Click Prescription... to open the Prescription pop-up.
- (Optional) For each Class, under the column Comment, type in comments - based on the information acquired from on-site scouting. For example, the comments can be based on the plant's health condition based on the notes taken in the field.
- (Optional) For each Class, under the column Rate, type in rate values based on which fertilizer will be applied.
- (Optional) Export the Classes as a .shp file. This file can be imported directly into the tractor's field (fertilizer) application displays. For more information: Menu View > Index Calculator > Sidebar > 5. Export.