- For a detailed description of how to analyze the Quality Report: Quality Report Help.
- For a description of how to analyze the Quality Report: Step 4. Processing.
The Quality Report is automatically displayed after each step of processing. To not be displayed automatically, unselect the Display Automatically after Processing box at the bottom of the Quality Report.
After Step 1. Initial Processing processing failed:
After Step 1. Initial Processing is completed:
- Summary
- Quality Check
- Preview
- Calibration Details
- Initial Image Positions
- Computed Image/GCP/Manual Tie Points Positions
- Absolute Camera Position and Orientation Uncertainties
- Overlap
- Bundle Block Adjustment Details
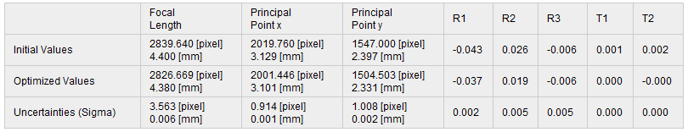
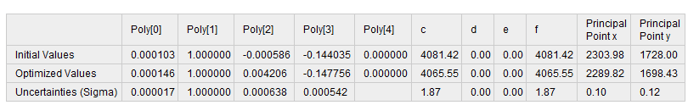
- Internal Camera Parameters for Perspective Lens
- Internal Camera Parameters for Fisheye Lens
- Internal Camera Parameters Correlation
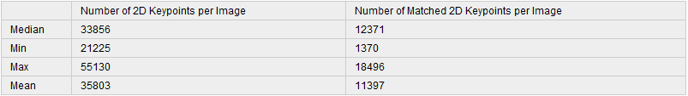
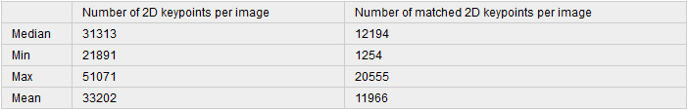
- 2D Keypoints Table
- 2D Keypoints Table for Camera
- Median / 75% / Maximal Number of Matches Between Camera Models
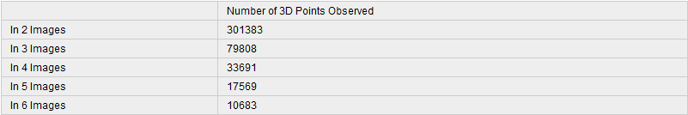
- 3D Points from 2D Keypoint Matches
- 2D Keypoint Matches
- Relative Camera Position and Orientation Uncertainties
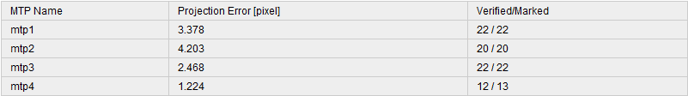
- Manual Tie Points
- Ground Control Points
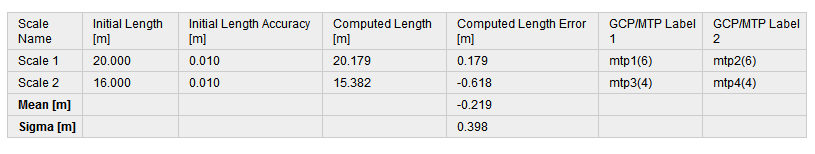
- Scale Constraints
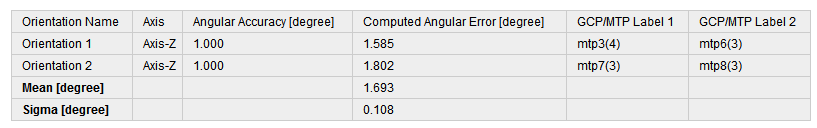
- Orientation Constraints
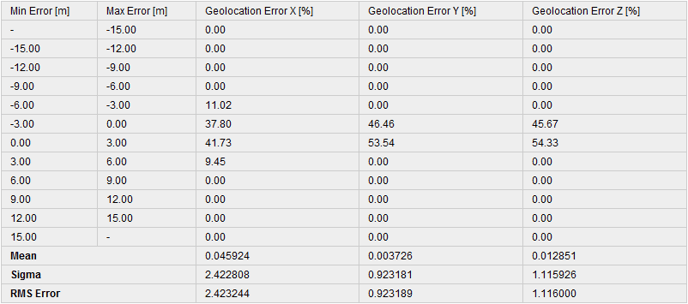
- Absolute Geolocation Variance
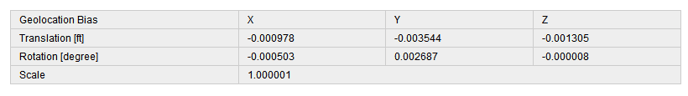
- Geolocation Bias
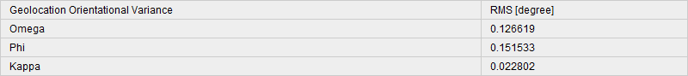
- Image Orientation Variance
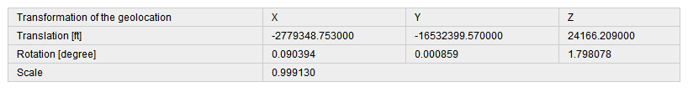
- Geolocation Coordinate System Transformation
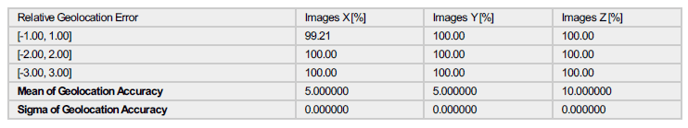
- Relative Geolocation Variance
- Rolling Shutter Statistics
- Initial Processing Details
After Step 2. Point Cloud and Mesh is completed:
After Step 3. DSM, Orthomosaic and Index is completed:
| Summary | |
|---|---|
| Project: | Name of the project. |
| Processed: | Date and time of processing. |
| Camera Model Name(s) | The name of the camera model(s) used to capture the images. |
| Rig Name (s) | The name of the rigs used to capture the images. If a rig is detected, all the cameras of the rig will appear in the Camera Model Name above. |
| Average Ground Sampling Distance (GSD): | The average GSD of the initial images. For more information about the GSD: Ground sampling distance (GSD). |
| Area Covered: | The 2D area covered by the project. This area is not affected if a smaller Processing Area has been drawn. |
| Time for Initial Processing (without report): | The time for Initial Processing without taking into account the time needed for the generation of the Quality Report. |
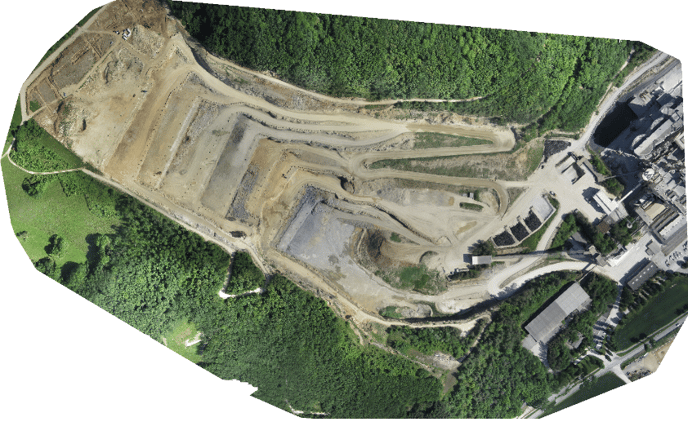
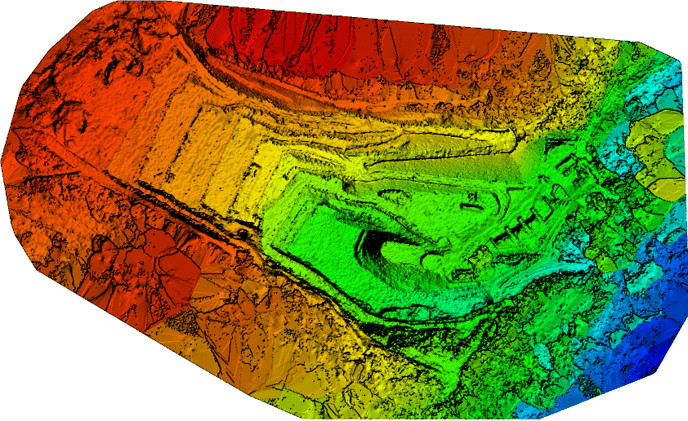
| Preview | ||
 |
 |
|
| Figure 1: Orthomosaic and the corresponding sparse Digital Surface Model (DSM) before densification. | ||
| Calibration Details | |
| Number of Calibrated Images: | Number of the images that have been calibrated, i.e. the number of images that have been used for the reconstruction, with respect to the total number of the images in the project (enabled and disabled images) |
| Number of Geolocated Images: | Number of the images that are geolocated. |
| Initial Image Positions |
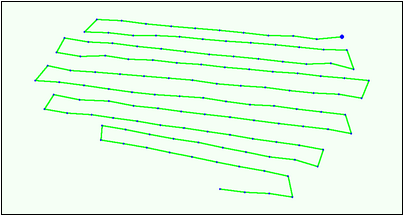 |
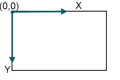
| Figure 2: Top view of the initial image position. The green line follows the position of the images in time starting from the large blue dot. |
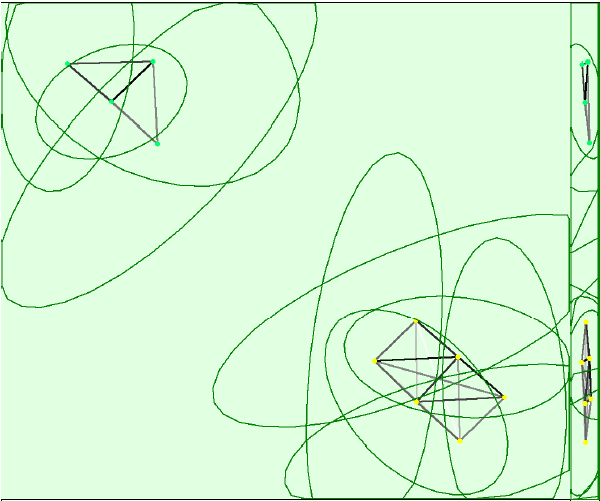
| Computed Image/GCP/Manual Tie Points Positions |
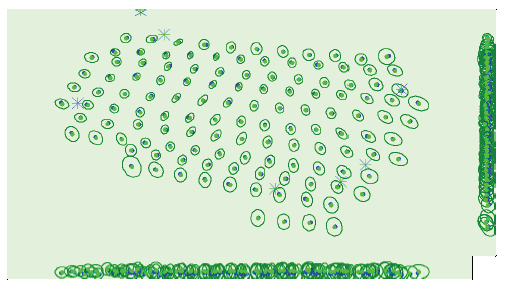 |
| Figure 3: Offset between initial (blue dots) and computed (green dots) image positions as well as the offset between the GCPs initial positions (blue crosses) and their computed positions (green crosses) in the top-view (XY plane), front-view (XZ plane), and side-view (YZ plane). Dark green ellipses indicate the absolute position uncertainty (Nx magnified) of the bundle block adjustment result. |
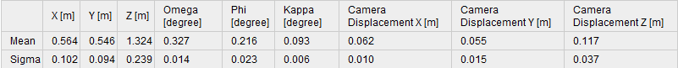
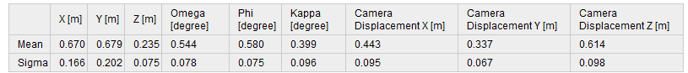
| Absolute Camera Position and Orientation Uncertainties | ||
 |
||
| Mean X/Y/Z: | Mean uncertainty in the X/Y/Z direction of the absolute camera positions. | |
| Mean Omega/Phi/Kappa: | Mean uncertainty in the omega/phi/kappa orientation angle of the absolute camera positions. | |
| Mean Camera Displacement X/Y/Z: | Only available for projects processed with Linear Rolling Shutter. Mean uncertainty in the camera displacement in the X/Y/Z direction of the absolute camera positions. | |
| Sigma X/Y/Z: | Sigma of the uncertainties in the X/Y/Z direction of the absolute camera positions. | |
| Sigma Omega/Phi/Kappa: | Sigma of the uncertainties in the omega/phi/kappa angle of the absolute camera positions. | |
| Sigma Camera Displacement X/Y/Z: | Only available for projects processed with Linear Rolling Shutter. Sigma of the uncertainties in the camera displacement in the X/Y/Z direction of the absolute camera positions. | |
| Overlap |
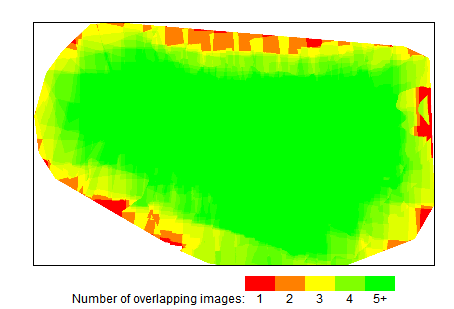 |
| Figure 4: Number of overlapping images computed for each pixel of the orthomosaic. Red and yellow areas indicate low overlap for which poor results may be generated. Green areas indicate an overlap over 5 images for every pixel. Good quality results will be generated as long as the number of keypoint matches is also sufficient for these areas (see Figure 5 for keypoint matches). |
| Bundle Block Adjustment Details | |
| Number of 2D Keypoint Observations for Bundle Block Adjustment: | The number of automatic tie points on all images that are used for the AAT/BBA. It corresponds to the number of all keypoints (characteristic points) that could be matched on at least two images. |
| Number of 3D Points for Bundle Block Adjustment: | The number of all 3D points that have been generated by matching 2D points on the images. |
| Mean Reprojection Error [pixels]: | The average of the reprojection error in pixels.
Each computed 3D point has initially been detected on the images (2D keypoint). On each image, the detected 2D keypoint has a specific position. When the computed 3D point is projected back to the images it has a re-projected position. The distance between the initial position and the re-projected one gives the re-projection error. For more information: Reprojection error. |


| Internal Camera Parameters Correlation |
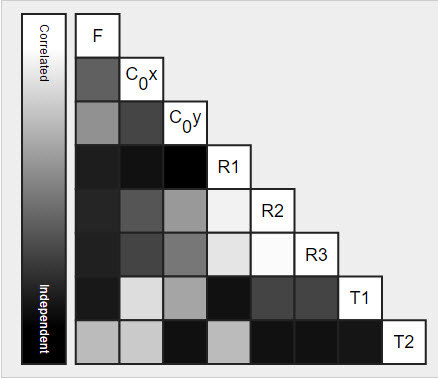 |
| The correlation between camera internal parameters determined by the bundle adjustment. The correlation matrix displays how much the internal parameters compensate for each other. White indicates a full correlation between the parameters, i.e. any change in one can be fully compensated by the other. Black indicates that the parameter is completely independent, and is not affected by other parameters. |
| Median / 75% / Maximal Number of Matches Between Camera Models | |
 |
|
| Median / 75% / Maximum: | The median, 75% (upper quartile), maximum number of matches between two camera models. If a cell is empty, no matches have been computed between the corresponding cameras. |
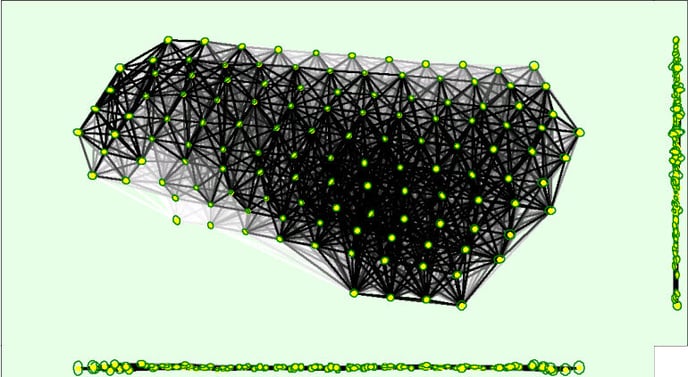
| 2D Keypoint Matches |
 |
|
Figure 5: Top view of the image computed positions with a link between matching images. The darkness of the links indicates the number of matched 2D keypoints between the images. Bright links indicate weak links and require Manual Tie Points or more images. Dark green ellipses indicate the relative camera position uncertainty (Nx magnified) of the bundle block adjustment result. The 2D Keypoint Matches graph displays each block with a different color (green and yellow in the following example): |
 |
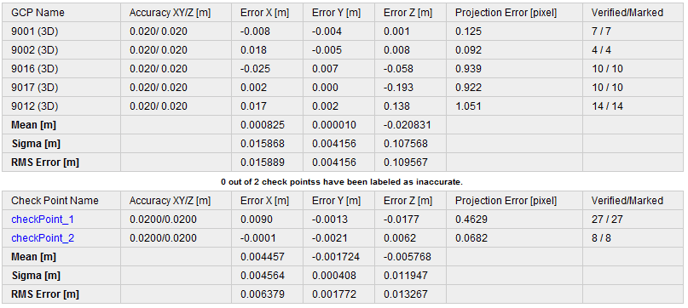
| Ground Control Points |
|
|---|---|
 |
|
| GCP Name: | The name of the GCP together with the GCP type. The type can be:
|
| Check Point Name: | The name of the Check Point. |
| Accuracy XY / Z [m]:
Accuracy XY / Z [ft]: |
The Accuracy XY of the GCP/Check Point that has been given by the user in XY direction / The Accuracy Z of the GCP/Check Point that has been given by the user in Z direction. The accuracy indicates the accuracy of the GCP/Check Point in each direction. |
|
Error X [m]: Error X [ft]: |
The difference between the computed GCP/Check Point 3D point and the original position in X direction (original position - computed position). |
|
Error Y [m]: Error Y [ft]: |
The difference between the computed GCP/Check Point 3D point and the original position in Y direction (original position - computed position). |
|
Error Z [m]: Error Z [ft]: |
The difference between the computed GCP/Check Point 3D point and the original position in Z direction (original position - computed position). |
| Projection Error [pixel]: | Average distance in the images where the GCP/Check Point has been marked and where it has been reprojected. |
| Verified/Marked: | Verified: The number of images on which the GCP/Check Point has been marked and are taken into account for the reconstruction. Marked: The images on which the GCP/Check Point has been marked. |
|
Mean [m]: Mean [ft]: |
The mean / average error in each direction (X,Y,Z). For more information: How are the GCP Errors defined in the Quality Report?. |
|
Sigma [m]: Sigma [ft]: |
The standard deviation of the error in each direction (X,Y,Z). For more information: How are the GCP Errors defined in the Quality Report?. |
|
RMS Error [m]: RMS Error [ft] |
The Root Mean Square error in each direction (X,Y,Z). For more information: How are the GCP Errors defined in the Quality Report?. |
| Rolling Shutter Statistics | |
|---|---|
 |
|
| Figure 6: Camera movement estimated by the rolling shutter camera model. The green line follows the computed image positions. The blue dots represent the camera position at the start of the exposure. The blue lines represent the camera motion during the rolling shutter readout, re-scaled by a project dependent scaling factor for better visibility. | |
|
|
|
| Median camera speed: | The median speed of the drone while taking the images. |
| Median rolling shutter displacement (during sensor readout): | The median rolling shutter displacement of the camera while taking the image (readout). |
| Median rolling shutter time: | The median time of taking an image. |

Initial Processing Details
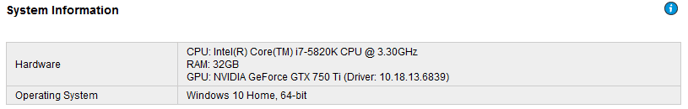
| System Information | ||
|---|---|---|
 |
||
| Hardware: | CPU, RAM, and GPU for processing. | |
| Operating System: | Operating System used for processing. | |
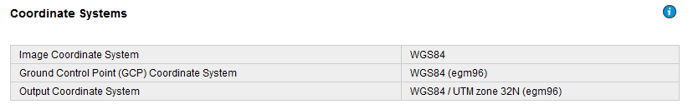
| Coordinate Systems | ||
|---|---|---|
 |
||
| Image Coordinate System | Coordinate system of the image geolocation. | |
| Ground Control Point (GCP) Coordinate System | Coordinate system of the GCPs, if GCPs are used. | |
| Output Coordinate System | Output coordinate system of the project | |
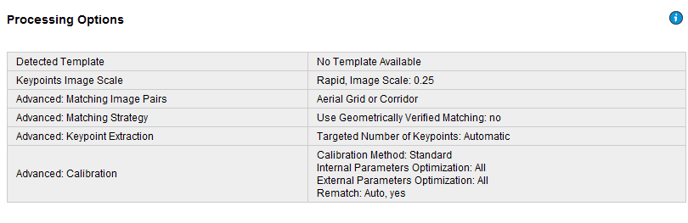
| Processing Options | ||
|---|---|---|
 |
||
| Detected Template: | Processing Option Template, if a template has been used. | |
| Keypoints Image Scale: | The image scale at which keypoints are computed. The scale can be chosen in 3 different ways:
The following image scales can be selected:
|
|
| Advanced: Matching Image Pairs: | Defines how to select which image pairs to match. There are 3 different ways to select them:
|
|
| Advanced: Matching Strategy: | Images are matched either using or not the Geometrically Verified Matching. | |
| Advanced: Keypoint Extraction: | Target number of keypoints to extract. The target number can be:
|
|
| Advanced: Calibration: | Calibration parameters used:
|
|
| Advanced:Automatic Sky Masking | Only available for Bebod 2 projects. | |
| Rig Processing |
Only available for rig projects. |
|
Point Cloud Densification Details
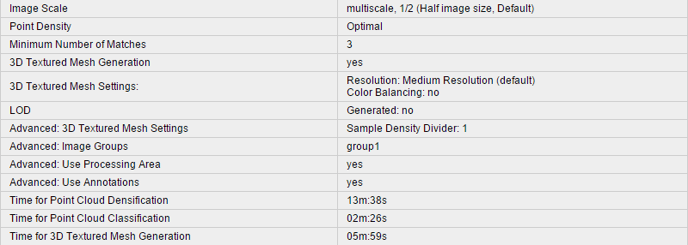
| Processing Options | |
|---|---|
 |
|
| Image Scale: |
Image scale used for the point cloud densification:
Displays also if Multiscale is used. |
| Point Density: | Point density of the densified point cloud. It can be:
|
| Minimum Number of Matches: | The minimum number of matches per 3D point represents the minimum number of valid re-projections of this 3D point on the images. It can be 2-6. |
| 3D Textured Mesh Generation: | Displays if the 3D Textured Mesh has been generated or not. |
| 3D Textured Mesh Settings: |
Displays the Processing Settings for the 3D Textured Mesh generation. Resolution: The selected the resolution for the 3D Textured Mesh generation. It can be:
Color Balancing: It appears when the Color Balancing algorithm is selected for the generation of the texture of the 3D Texture Mesh. |
| LOD |
Generated: It can be yes or no. |
| Advanced: 3D Textured Mesh Settings: |
Sample Density Divider: It can be between 1-5. |
| Advanced: Matching Window Size: | Size of the grid used to match the densified points in the original images. |
| Advanced: Image Groups: | Image groups for which a densified point cloud has been generated. One densified point cloud is generated per group of images. |
| Advanced: Use Processing Area: | Displays if the Processing Area is taken into account or not. |
| Advanced: Use Annotations: | If annotations are taken into account or not, as selected in the processing options for step 2. Point Cloud and Mesh. |
| Advanced: Limit Camera Depth Automatically: | Displays if the camera depth is automatically limited or not. |
| Time for Point Cloud Densification: | Time spent to generate the densified point cloud. |
| Time for Point Cloud Classification: | Time spent to generate the classified point cloud. |
| Time for 3D Textured Mesh Generation: | Time spent to generate the 3D Textured Mesh. Displays NA if no 3D Texture Mesh has been generated. |
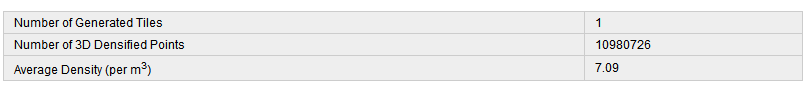
| Results | |
|---|---|
 |
|
| Number of Processed Clusters: | Displays the number of clusters generated, if more than 1 cluster has been generated. |
| Number of Generated Tiles: | Displays the number of tiles generated for the densified point cloud. |
| Number of 3D Densified Points: | Total number of 3D densified points obtained for the project. |
| Average Density (per m3): | Average number of 3D densified points obtained for the project per cubic meter. |
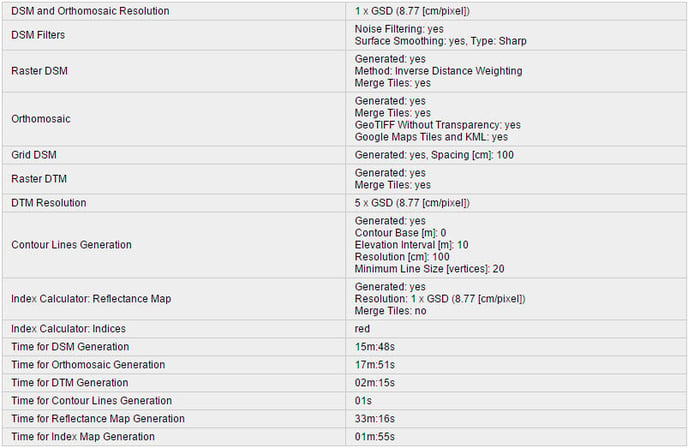
DSM, Orthomosaic and Index Details
| Processing Options | |
|---|---|
 |
|
| DSM and Orthomosaic Resolution: | Resolution used to generate the DSM and Orthomosaic. If the mean GSD computed at step 1. Initial Processing is used, its value is displayed. |
| DSM Filters: |
Displays if the Noise Filtering is used as well as the Surface Smoothing. If the Surface Smoothing is used, its type is displayed as well. It can be:
|
| Raster DSM: |
Displayed if the DSM is generated. Displays which Method has been used to generate the DSM. It can be:
Displays if the DSM tiles have been merged into one file. |
| Orthomosaic: |
Displays if the Orthomosaic is generated. Displays if the Orthomosaic tiles have been merged into one file. Displays if the GeoTIFF without Transparency and the Google Maps Tiles and KML are generated. |
| Grid DSM: | Displays if the Grid DSM is generated. Displays which Grid Spacing has been used. |
| Raster DTM: | Displayed if the DTM is generated. Displays if the Tiles are merged. |
| DTM Resolution: | Displays the resolution used to generate the DTM. |
| Contour Lines Generation: |
Displays if the contour lines are generated. Displays the values of the following parameters that have been used:
|
| Index Calculator: Radiometric Calibration: | Displayed if the Radiometric Calibration has been used. |
| Index Calculator: Reflectance Map: | Displayed if the Reflectance Map has been generated. Displays the Resolution at which it has been generated as well as if the Reflectance Map Tiles have been merged into one file. |
| Index Calculator: Indices: | Displayed if Indices have been generated. Displays the list of generated Indices. |
| Index Calculator: Index Values: | Displayed if the Indices have been exported as Point Shapefile Grid Size or as Polygon Shapefile. Displays the grid size for the generated outputs. |
| Time for DSM Generation: | Time spent to generate the DSM. |
| Time for Orthomosaic Generation: | Time spent to generate the Orthomosaic. |
| Time for DTM Generation: | Time spent to generate the DTM. |
| Time for Contour Lines Generation: | Time spent to generate the Contour Lines. |
| Time for Reflectance Map Generation: | Time spent to generate the Reflectance Map. |
| Time for Index Map Generation: | Time spent to generate the Index Map. |
| Camera Radiometric Correction | |
|---|---|
| Camera Name: | Displays the name of the camera. |
| Band: | Displays the bands of the camera to which a Radiometric Correction was applied. |
| Radiometric Correction Type: | Displays the type of Radiometric Correction applied to the images of a band: Camera Only, Camera and Sun Irradiance, or Camera, Sun Irradiance and Sun Angle. |