This article explains the different export format options that are available under Index Calculator on PIX4Dmapper.
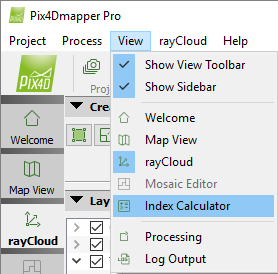
Access: On the Menu bar, click
View > Index Calculator (available once step
1. Initial Processing has been completed).
The Index Calculator sidebar is displayed on the right of the main window. For information about the sidebar's display possibilities:
Displaying bars.
On the left part of section 5. Export, there is an arrow that allows the user to show/hide the section by clicking on it:
-
 By default the 5. Export is expanded and visible.
 -
 Section 5. Export is collapsed and hidden.
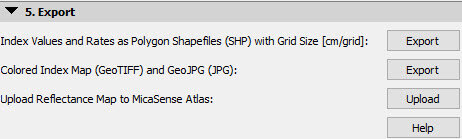
The following information is displayed:
- Index Values and Rates as Polygon Shapefiles (.shp) with Grid Size [unit/grid]
Exports the classes as a .shp file (polygon and grid) based on the selected Processing Options: Menu Process > Processing Options... > 3. DSM, Orthomosaic and Index > Index Calculator. One shapefile will be exported for each Region. This file can be imported directly into the tractor's displays for field (fertilizer) application.
- Colored Index Map GeoTIFF (.tif) and GeoJPG (.jpg)
Exports a Colored Index Map that is generated by applying the defined coloring rules to the Index Map. It is a raster file with RGB values. A single Colored Index Map will be exported for all the regions in 3 formats: .jpg, .tiff and .kml.
- Upload Reflectance Map to MicaSense Atlas Uploads the necessary reflectance maps for further processing on the MicaSense Atlas platform.
Note: MicaSense Uploader needs to be installed on the computer in order to upload to MicaSense Atlas.