For information about the sidebar's display possibilities: Displaying bars.
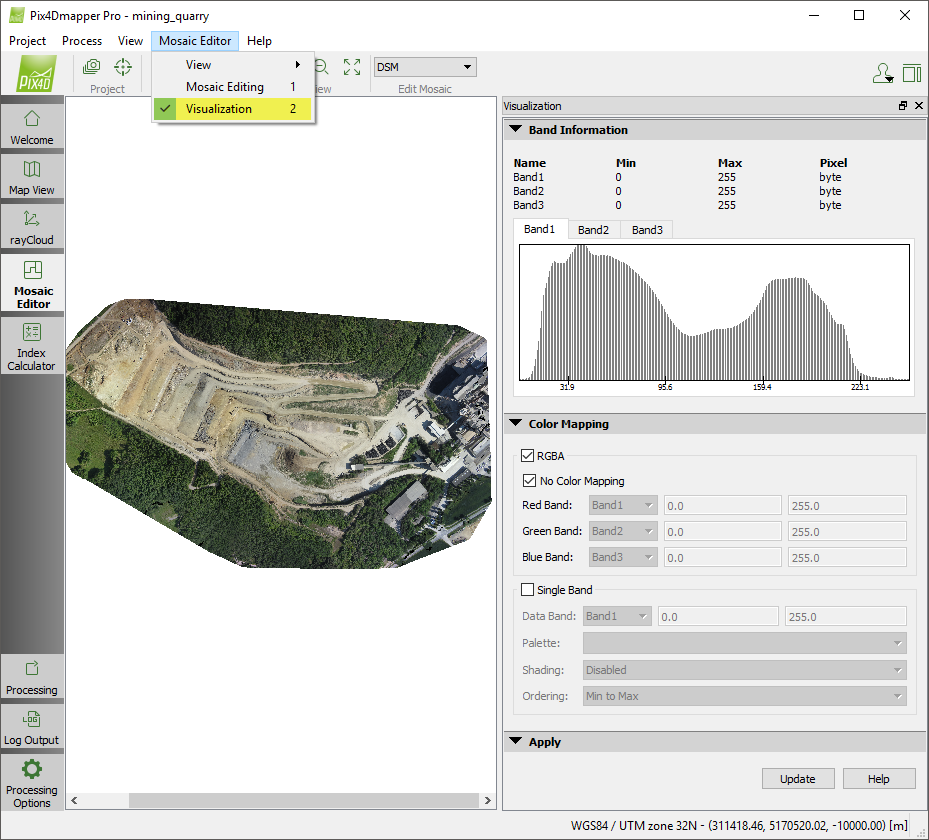
The Mosaic Editing sidebar contains the following sections:
- Band Information: Displays information for the different bands of the mosaic group / DSM / DTM.
- Color Mapping: Allows the user to change the values to be considered for visualization for each pixel and the visualization rules.
- Apply: Allows the user to apply the changes. It considers the visualization parameters to be used in the Mosaic View.
Band Information
It displays information for the different bands of the mosaic group / DSM / DTM.
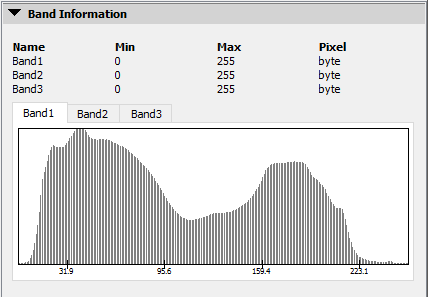
The following information is displayed:
- Name: Name of the band.
- Min: Minimum pixel value for all the pixels of the band.
- Max: Maximum pixel value for all the pixels of the band.
- Pixel: Data type, how many bytes are used to store the information of each band.
The band histogram section has one tab per band.
The histogram displays how many pixels in the model have a certain value for each band.
Color Mapping
Allows the user to change the values to be considered for visualization for each pixel and the visualization rules.
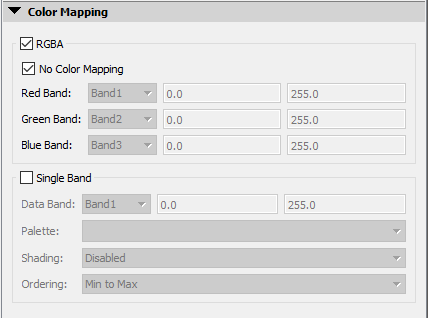
It contains 2 sections:
RGBA
Selected by default for Mosaics.
It uses always 3 bands: The final color visualized will be the combination of the values for the 3 bands.
It is possible to select:
- No color mapping: Selected by default. It takes the values from the original mosaic file.
- Red band: Grayed out unless No color mapping is not selected. It allows the user to select which band is considered as the red band for the visualization.
- Green band: Grayed out unless No color mapping is not selected. It allows the user to select which band is considered as the green band for the visualization.
- Blue band: Grayed out unless No color mapping is not selected. It allows the user to select which band is considered as the blue band for the visualization.
Single Band
Selected by default for the DSM / DTM.
It is possible to use only one band. The final color visualized will consider only the values of one band.
- Data band: Allows the user to select which band will be used for visualization.
- Palette: Allows the user to select the palette of colors for the visualization of the values of the selected band. The different available options are:
- Atlas: It uses the Atlas standard palette. Selected by default for DSM. It uses a palette using blue for low values, yellow for middle values and red for high values.
- HSV: It uses the HSV standard palette.
- RdYlGn: Low values are red, medium values are yellow and high values are green, used for agriculture.
- Thermal: Low values are blue, high values are red. It is used for temperature measurements.
- Spectral: It uses all the colors from the visual spectrum. It is used when many different values need to be distinguished.
- Grays: It uses a gray scale.
- Blues: It uses blue scale.
- Red: It uses red scale.
- Shading: Allows the user to disable / enable shading using illumination based on the values of each pixel on the model. For more information: How Hillshade works. The different options available are:
- Enabled: Selected by default, it uses shading.
- Disabled: It does not use shading.
- Ordering: Allows the user to invert the selected colors distribution. The different options available are:
- Min to Max: Selected by default. It uses the standard colors distribution for the selected palette.
- Max to Min: It inverts the selected colors distribution for the selected palette.
Apply
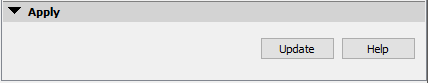
Contains the following buttons:
- Update: It applies the changes and considers the visualization parameters to be used in the Mosaic View.
- Help: It opens PIX4Dmapper help.
- The Mosaic Editor may be used to manually correct artifacts in the Orthomosaic resulting from Step 3. DSM, Orthomosaic and Index and in order to improve its visual aspect.
- The changes applied in the Mosaic Editor affect a local copy, not the mosaic resulting from Step 3. DSM, Orthomosaic and Index.
- In order to obtain the edited mosaic, the mosaic needs to be exported: How to edit the Orthomosaic. The orthomosaic resulting from Step 3. DSM, Orthomosaic and Index will then be overwritten. The Grid DSM as well as the different orthomosaic formats (GeoTIFF, Google Maps Tiles, etc.) will be generated if selected in the processing options.
- For more information about the Mosaic Editor processes workflow: Mosaic Editor Workflow.