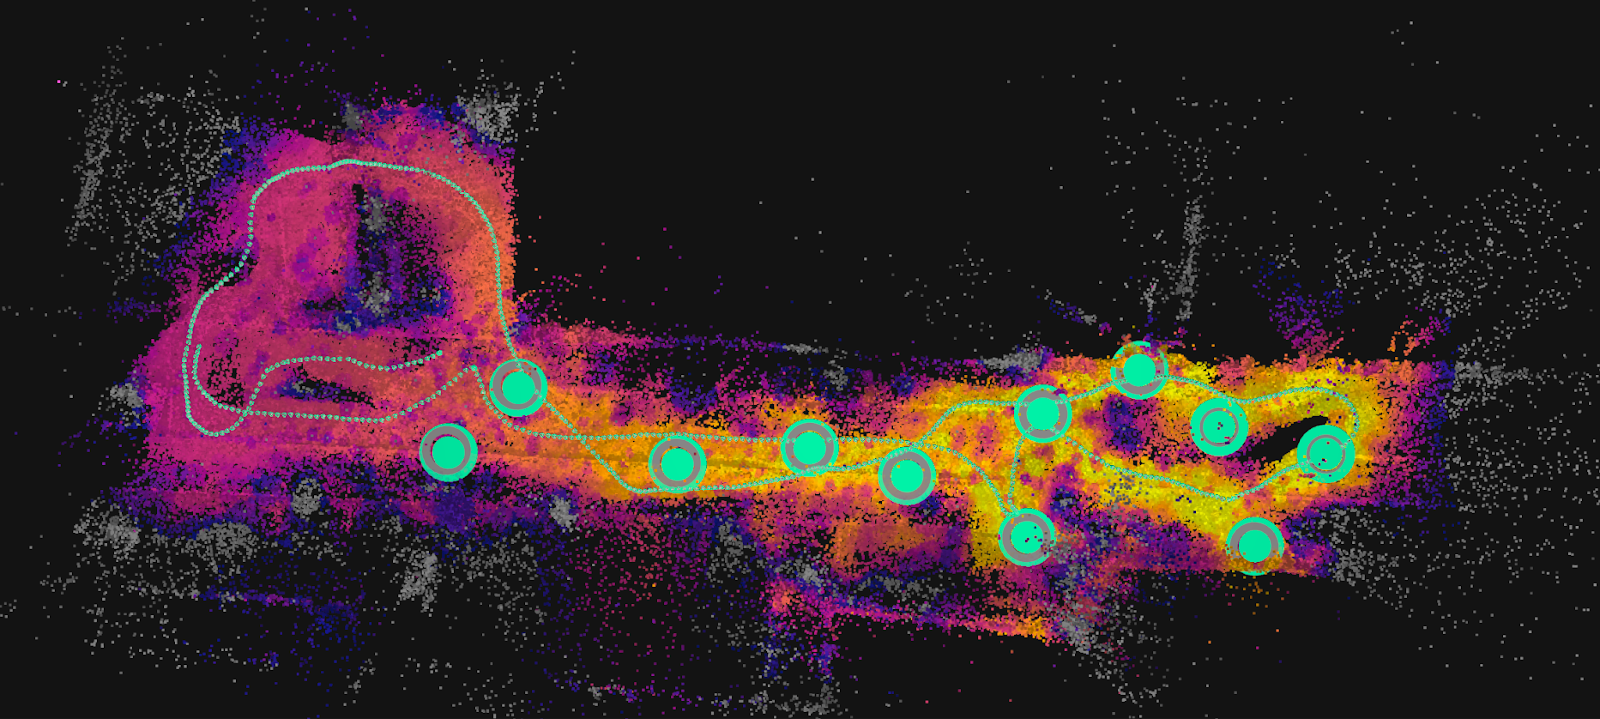
The relative confidence map serves as a visual representation illustrating the precision variations across different areas within a scene. It utilizes a color scheme to depict relative confidence intervals, where a value of 1 signifies high relative confidence, and 0 indicates low relative confidence. This tool is available after the completion of the calibration step and allows for coloration of the automatic tie points (ATPs) point cloud and, if available, the dense point cloud.
IN THIS ARTICLE
How to use Color by relative confidence
Access
Customization
Visualization interpretation
Frequently Asked Questions (FAQ)
- This tool does not evaluate the absolute quality of calibration; other tools such as checkpoints are recommended to be used for that purpose. This tool serves as a visual aid to identify areas with differing confidence in calibration.
- This tool should not be used to assess the quality of the geolocation of the project. The use of Ground Control Points is highly recommended for that purpose.
Access
To access Color by relative confidence:
- Click Settings
 located on the left side of the screen.
 - The Color by relative confidence
 toggle will be visible. Enable the toggle button
  .
.
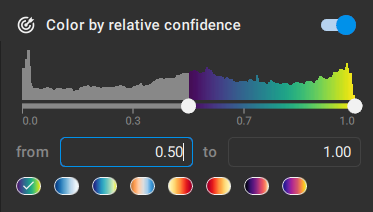
Customization
To customize the relative confidence map
- Determine the desired spectrum of the relative confidence map:
- By adjusting the toggles.
- By setting the interval values.
- Choose a color palette.
- Points outside the specified interval spectrum will be colored in gray.
The colors on the map signify the consistency of calibration across different areas. Points close to 1 indicate less uncertainty in calibration output compared to other points in the same scene. Conversely, points close to 0 highlight areas where calibration is more uncertain relative to other scene points. If a dense point cloud processing step is performed, the tool also colors the point cloud, providing a higher density representation. However, the coloring of the dense point cloud is performed only for visual purposes, and should not be interpreted as a measure of the quality of the densification process. This tool is designed to visualize relationships between different areas within the same scene concerning calibration output, not to assess the absolute quality of the photogrammetric outputs.
Is the relative confidence map a measure indicator of the absolute quality of the calibration of my project?
No, this tool does not evaluate the absolute quality of calibration; use other tools such as checkpoints for that purpose. It serves as a visual aid to identify areas with differing confidence in calibration.
Can I use the tool to assess the quality of the geolocation of the project?
No, the use of GCPs and checkpoints is highly recommended for that purpose.
Why do you use the term 'relative' for confidence?
'Relative' indicates confidence is specific to the current scene and cannot be used for comparisons across different projects.
Why are the depth and fused point clouds not colored?
These outputs result from algorithms minimally influenced by calibration, making the relative confidence calculation inapplicable.
What can I do to improve the relative confidence of a project?
Adding ground control points (GCPs) or manual tie points (MTPs) can enhance relative confidence in specific areas.
I added MTPs in a specific area without improving the calibration, is this an indication of something going wrong?
No, the quality of the photogrammetry output depends on many factors, adding MTPs can improve other aspects of the output, without necessarily improving the relative confidence.
The edges of the project are always of lower relative confidence. Is this a problem?
Lower confidence at project edges may result from lower coverage and does not necessarily indicate poor calibration output.